
Mathematics, 30.04.2021 05:40 s11632270
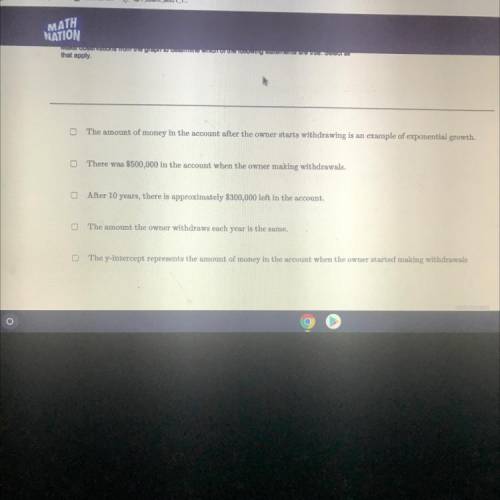
The following graph represents a retirement savings account after the owner of the account begins
withdrawing 5% each year.
500000
400000
Amount remaining (in dollars)
300000
200000
100005
10 20 30 40 50 60 700 90 100 110 1205
Number of years after owner begins withdrawing
Make observations from the graph to determine which of the following statements are true Select all
that apply

Answers: 2


Other questions on the subject: Mathematics
Mathematics, 21.06.2019 17:40, PONBallfordM89
How can the correlation in the scatter plot graph below best be described? positive correlation negative correlation both positive and negative no correlation
Answers: 1
Mathematics, 21.06.2019 18:00, lovemykay2355
If f(x) = 4x – 3 and g(x) = 8x + 2, find each function value a. f[g(3)] b. g[f(5)] c. g{f[g(-4)]}
Answers: 3
You know the right answer?
The following graph represents a retirement savings account after the owner of the account begins...
Questions in other subjects:


Mathematics, 02.04.2021 04:20
Mathematics, 02.04.2021 04:20

Social Studies, 02.04.2021 04:20
Chemistry, 02.04.2021 04:20


