
Mathematics, 29.04.2021 22:40 kennyg02
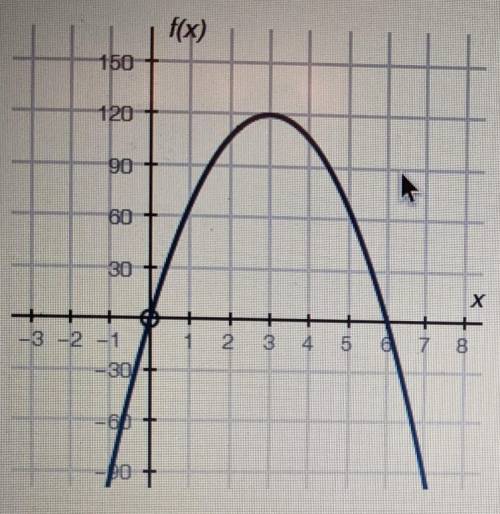
The graph below (linked) shows a company's profit f(x), in dollars, depending on the price of pens x, and dollars, being sold by the company:
Part A: What do the X intercepts and maximum value of the graph represent? What are the intervals where the function is increasing and decreasing, and what do they represent about the sale and profit? (6points)
Part B: What is an approximate average rate of change of the graph from x = 3 to x = 5, and what does this rate represent? (4 points)
(PLEASEEE explain. I am trying to understand this as best as possible)

Answers: 1


Other questions on the subject: Mathematics
Mathematics, 21.06.2019 20:30, bullockarwen
Which coefficient matrix represents a system of linear equations that has a unique solution ? options in photo*
Answers: 1
Mathematics, 21.06.2019 20:50, tra10money
An object is translated by (x + 4, y - 2). if one point in the image has the coordinates (5, -3), what would be the coordinates of its pre-image? (9, -5) (1, -5) (9, -1) (1, -1)
Answers: 1
You know the right answer?
The graph below (linked) shows a company's profit f(x), in dollars, depending on the price of pens x...
Questions in other subjects:

History, 22.07.2019 12:20
Mathematics, 22.07.2019 12:20

Chemistry, 22.07.2019 12:20

Mathematics, 22.07.2019 12:20

History, 22.07.2019 12:20

History, 22.07.2019 12:20


