
Mathematics, 29.04.2021 22:30 denaemarie02
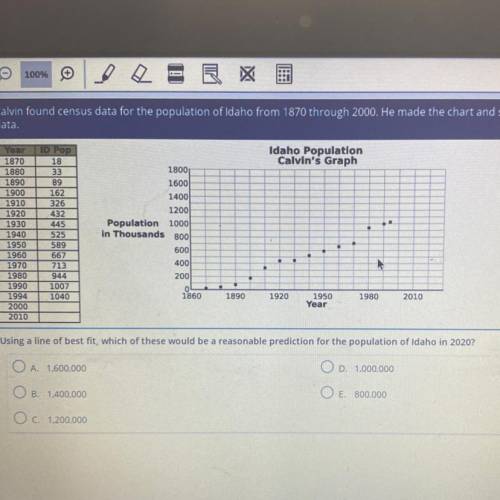
Calvin found census data for the population of Idaho from 1870 through 2000. He made the chart and scatter plot using this
data.
Idaho Population
Calvin's Graph
Yaar
1870
1880
1890
1900
1910
1920
1930
1940
1950
1960
1970
1980
1990
1994
2000
2010
TID Pop
18
33
89
162
326
432
445
525
589
667
713
944
1007
1040
1800
1600)
1400
1200
Population 1000
in Thousands 800
600
400
200
OL
1860
1890
1920
1950
Year
1980
2010
Using a line of best fit, which of these would be a reasonable prediction for the population of Idaho in 2020?
O A 1.600.000
O D. 1,000,000
O B. 1,400,000
O E. 800.000
O c. 1.200.000

Answers: 2


Other questions on the subject: Mathematics
Mathematics, 21.06.2019 14:00, brookeguilford
If benito is selecting samples of five values from the table, which row will result in the greatest mean? row 1 row 2 row 3 row 4
Answers: 2
Mathematics, 21.06.2019 16:30, cameronbeaugh
The ratio of men to women working for a company is 4 to 5 . if there are 90 women working for the company, what is the total number of employees?
Answers: 1
You know the right answer?
Calvin found census data for the population of Idaho from 1870 through 2000. He made the chart and s...
Questions in other subjects:

Arts, 22.10.2020 23:01


Physics, 22.10.2020 23:01
Mathematics, 22.10.2020 23:01
Mathematics, 22.10.2020 23:01

Social Studies, 22.10.2020 23:01
Mathematics, 22.10.2020 23:01


