
Mathematics, 29.04.2021 22:10 hannacarroll2539
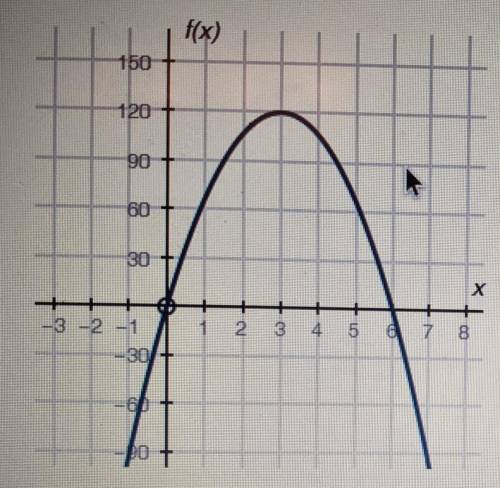
The graph below (linked) shows a company's profit f(x), in dollars, depending on the price of pens x, and dollars, being sold by the company:
Part A: What do the X intercepts and maximum value of the graph represent? What are the intervals where the function is increasing and decreasing, and what do they represent about the sale and profit? (6points)
Part B: What is an approximate average rate of change of the graph from x = 3 to x = 5, and what does this rate represent? (4 points)
(PLEASEEE explain. I am trying to understand this as best as possible)

Answers: 1


Other questions on the subject: Mathematics
You know the right answer?
The graph below (linked) shows a company's profit f(x), in dollars, depending on the price of pens x...
Questions in other subjects:
Mathematics, 03.12.2021 02:40


Biology, 03.12.2021 02:40
Mathematics, 03.12.2021 02:40

Health, 03.12.2021 02:40
Mathematics, 03.12.2021 02:40


