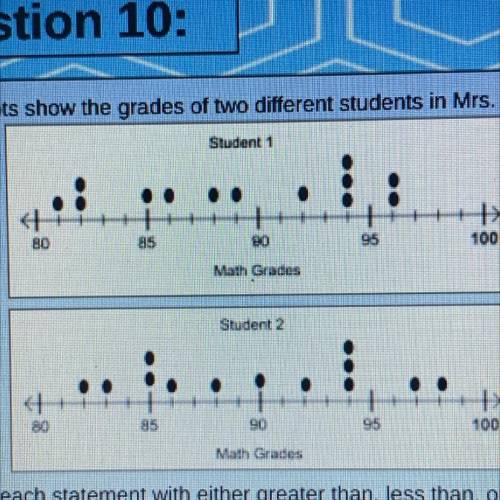
The dot plots show the grades of two different students in Mrs. Hite's math class
Student 1
...

Mathematics, 29.04.2021 20:30 kekebaby156
The dot plots show the grades of two different students in Mrs. Hite's math class
Student 1
30
015
100
Mit de
Student 2
>
100
0
85
90
13
Matades
Complete each statement with either greater than, less than or equal to
A.
B.
The mode of the data for Student 1 is greater than the mode of the data for Student 2
The median of the data for Student 2 is greater than the median of the data for
Student 1
The range of the data for Student 1 is equal to the range of the data for Student 2
The lowest grade for Student 1 is greater than the lowest grade for Student 2
C
D.

Answers: 1


Other questions on the subject: Mathematics
Mathematics, 21.06.2019 14:40, beebeck6573
Chose the graph below that represents the following system of inequality’s
Answers: 2
Mathematics, 21.06.2019 15:40, c1100321311
Which point on the x-axis lies on the line that passes through point c and is parallel to lino ab?
Answers: 1
Mathematics, 21.06.2019 20:20, maxi12312345
Aline passes through (1,-5) and(-3,7) write an equation for the line in point slope form rewrite the equation in slope intercept form
Answers: 1
You know the right answer?
Questions in other subjects:


Geography, 27.02.2020 03:50

Chemistry, 27.02.2020 03:50

Social Studies, 27.02.2020 03:50


