
Mathematics, 29.04.2021 20:20 jazmaine1217
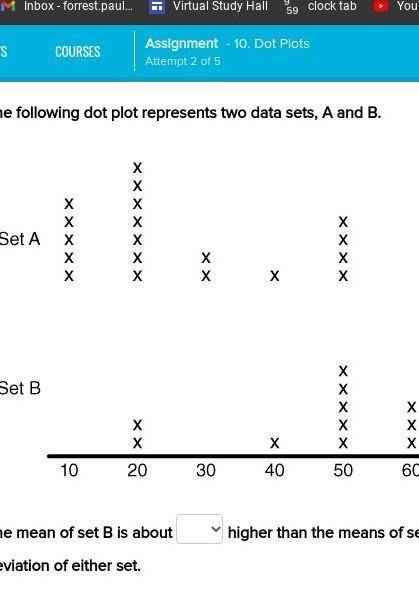
The following dot plot represents two data sets, A and B. The mean of set B is about 504030 higher than the means of set A, which is about twicethe same ashalf the mean absolute deviation of either set.

Answers: 1


Other questions on the subject: Mathematics
Mathematics, 21.06.2019 16:00, andyyandere8765
Which is the graph of the piecewise function f(x)? f(x)=[tex]f(x) = \left \{ {{-x+1, x\leq 0 } \atop {x+1, x\ \textgreater \ 0}} \right.[/tex]
Answers: 3
Mathematics, 21.06.2019 22:30, patrickfryer240
When i'm with my factor 5, my prodect is 20 .when i'm with my addend 6' my sum is 10.what number am i
Answers: 1
Mathematics, 22.06.2019 00:00, angeleyes42
Macy spent $36 on jeans. this was $12 less than twice what she spent on a shirt. which equation to solve this, 12x=36 2x=36-12 2x-12=36 12-2x=36
Answers: 1
You know the right answer?
The following dot plot represents two data sets, A and B. The mean of set B is about 504030 higher t...
Questions in other subjects:
Mathematics, 25.08.2019 11:20

Mathematics, 25.08.2019 11:20
Mathematics, 25.08.2019 11:20

Computers and Technology, 25.08.2019 11:20
Mathematics, 25.08.2019 11:20


Mathematics, 25.08.2019 11:20


