
Mathematics, 29.04.2021 20:10 bob8638
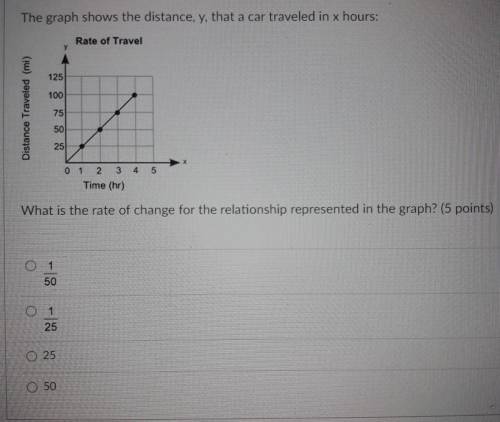
The graph shows the distance, y, that a car traveled in x hours: Rate of Travel 125 100 Distance Traveled (mi) 75 50 3 4 5 Time (hr) What is the rate of change for the relationship represented in the graph? (5 points) 50 1 25 Thing 0 25 O 50

Answers: 2


Other questions on the subject: Mathematics
Mathematics, 21.06.2019 21:30, mcaninch36
Scott’s bank account showed a balance of $750 on sunday. during the next five days, he made one deposit of $140 and numerous withdrawals of $180 each. let x represent the number of withdrawals that scott made. write an inequality that can be used to find the maximum number of withdrawals that scott could have made and maintain a balance of at least $100. do not use a dollar sign ($) in your response.
Answers: 1
Mathematics, 21.06.2019 22:00, ashhleyjohnson
After a dreary day of rain, the sun peeks through the clouds and a rainbow forms. you notice the rainbow is the shape of a parabola. the equation for this parabola is y = -x2 + 36. graph of a parabola opening down at the vertex 0 comma 36 crossing the x–axis at negative 6 comma 0 and 6 comma 0. in the distance, an airplane is taking off. as it ascends during take-off, it makes a slanted line that cuts through the rainbow at two points. create a table of at least four values for the function that includes two points of intersection between the airplane and the rainbow. analyze the two functions. answer the following reflection questions in complete sentences. what is the domain and range of the rainbow? explain what the domain and range represent. do all of the values make sense in this situation? why or why not? what are the x- and y-intercepts of the rainbow? explain what each intercept represents. is the linear function you created with your table positive or negative? explain. what are the solutions or solution to the system of equations created? explain what it or they represent. create your own piecewise function with at least two functions. explain, using complete sentences, the steps for graphing the function. graph the function by hand or using a graphing software of your choice (remember to submit the graph).
Answers: 2
Mathematics, 21.06.2019 23:00, benwill0702
The sum of 5consecutive even numbers is 100. what is the first number in this sequence?
Answers: 1
Mathematics, 21.06.2019 23:30, puppylover72
Find each value of the five-number summary for this set of data. [note: type your answers as numbers. do not round.] 46, 19, 38, 27, 12, 38, 51 minimum maximum median upper quartile lower quartile
Answers: 1
You know the right answer?
The graph shows the distance, y, that a car traveled in x hours: Rate of Travel 125 100 Distance Tra...
Questions in other subjects:

English, 12.09.2021 08:00
Mathematics, 12.09.2021 08:00
Mathematics, 12.09.2021 08:00

Mathematics, 12.09.2021 08:00

Chemistry, 12.09.2021 08:00
English, 12.09.2021 08:00


