
Mathematics, 29.04.2021 19:00 dhruvi62
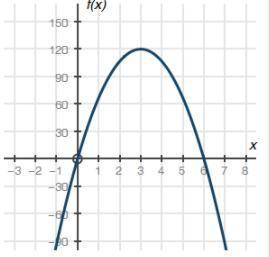
The graph below shows a company's profit f(x), in dollars, depending on the price of pens x, in dollars, sold by the company:
Graph of quadratic function f of x having x intercepts at ordered pairs 0, 0 and 6, 0. The vertex is at 3, 120.
Part A: What do the x-intercepts and maximum value of the graph represent? What are the intervals where the function is increasing and decreasing, and what do they represent about the sale and profit? (4 points)
Part B: What is an approximate average rate of change of the graph from x = 3 to x = 5, and what does this rate represent? (3 points)
Part C: Describe the constraints of the domain. (3 points)

Answers: 3


Other questions on the subject: Mathematics
Mathematics, 21.06.2019 14:30, snoodledoodlebop
anyone? find the second, fifth, and ninth terms of a sequence where the first term is 65 and the common difference is -7. 72, 93, 121 72, 79, 86 58, 37, 9 58, 51, 44
Answers: 1
Mathematics, 21.06.2019 19:00, jrsecession
Use the formulas a = x 2 – y 2, b = 2xy, c = x 2 + y 2 to answer this question. one leg of a right triangle has length 11 and all sides are whole numbers. find the lengths of the other two sides. the other leg = a0 and the hypotenuse = a1
Answers: 2
Mathematics, 21.06.2019 21:00, iisanchez27
Consider the polynomials given below. p(x) = x4 + 3x3 + 2x2 – x + 2 q(x) = (x3 + 2x2 + 3)(x2 – 2) determine the operation that results in the simplified expression below. 35 + x4 – 573 - 3x2 + x - 8 a. p+q b. pq c. q-p d. p-q
Answers: 2
You know the right answer?
The graph below shows a company's profit f(x), in dollars, depending on the price of pens x, in doll...
Questions in other subjects:
Mathematics, 16.08.2021 01:50
Mathematics, 16.08.2021 01:50


Mathematics, 16.08.2021 01:50


