
Mathematics, 29.04.2021 02:00 BreadOfTheBear
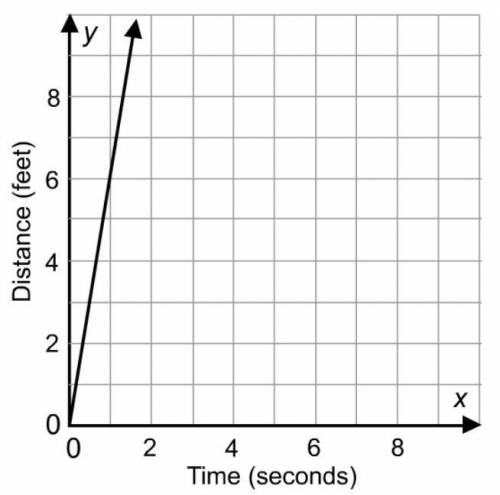
The graph shows Rudra’s walk. Identify the dependent and independent variables in this situation. Write an equation using the values/pattern in the graph. Use t for time and d for distance.

Answers: 2


Other questions on the subject: Mathematics
Mathematics, 21.06.2019 17:40, JessicaSontay8841
Follow these steps using the algebra tiles to solve the equation −5x + (−2) = −2x + 4. 1. add 5 positive x-tiles to both sides and create zero pairs. 2. add 4 negative unit tiles to both sides and create zero pairs. 3. divide the unit tiles evenly among the x-tiles. x =
Answers: 2
You know the right answer?
The graph shows Rudra’s walk. Identify the dependent and independent variables in this situation. Wr...
Questions in other subjects:


Mathematics, 28.05.2021 22:40

Chemistry, 28.05.2021 22:40

Mathematics, 28.05.2021 22:40


