
Mathematics, 28.04.2021 18:50 extra678
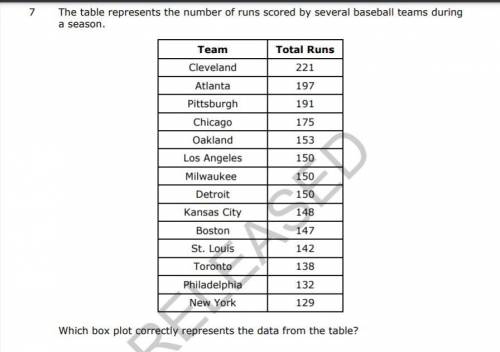
The table represents the number of runs scored by several baseball teams during a season.
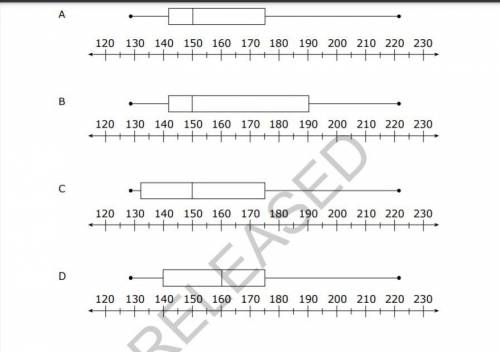
Which box plot correctly represents the data from the table?
Show your work IF you need to write out the data set above.
HELP ASAP THIS IS A BIG GRADE

Answers: 1


Other questions on the subject: Mathematics
Mathematics, 21.06.2019 14:00, lovelysoul4698
You and a friend race across a field to a fence and back. your friend has a 50-meter head start. the equations shown represent you and your friend's distances dd (in meters) from the fence tt seconds after the race begins. find the time at which you catch up to your friend. you: d=∣−5t+100∣d=∣−5t+100∣ your friend: d=∣−313t+50∣∣
Answers: 2
Mathematics, 21.06.2019 15:00, kkruvc
Ascatterplot is produced to compare the size of a school building to the number of students at that school who play an instrument. there are 12 data points, each representing a different school. the points are widely dispersed on the scatterplot without a pattern of grouping. which statement could be true
Answers: 1
Mathematics, 21.06.2019 19:00, lex112592
Samantha is growing a garden in her back yard. she spend $90 setting up the garden bed and buying the proper garden supplies. in addition, each seed she plants cost $0.25. a. write the function f(x) that represents samantha's total cost on her garden. b. explain what x represents. c. explain what f(x) represents. d. if samantha plants 55 seeds, how much did she spend in total?
Answers: 2
Mathematics, 21.06.2019 22:00, lraesingleton
What is the solution to the division problem below x3+x2-11x+4/x+4
Answers: 2
You know the right answer?
The table represents the number of runs scored by several baseball teams during a season.
Which bo...
Questions in other subjects:

History, 28.07.2019 18:00
History, 28.07.2019 18:00

Chemistry, 28.07.2019 18:00
Mathematics, 28.07.2019 18:00

Social Studies, 28.07.2019 18:00
Chemistry, 28.07.2019 18:00


