
Mathematics, 28.04.2021 01:20 lulu3371
3.
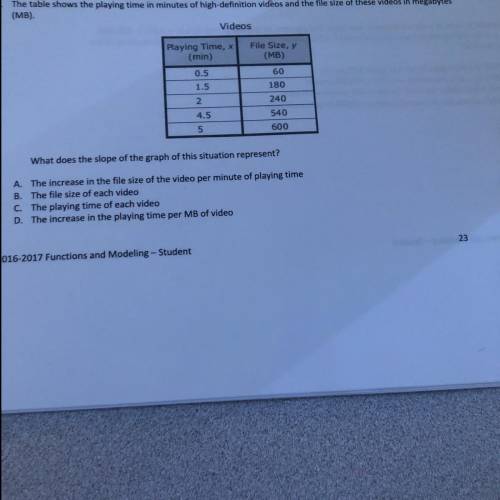
The table shows the playing time in minutes of high-definition videos and the file size of these videos in megabytes
(MB).
Videos
Playing Time, x
(min)
0.5
1.5
2
4.5
5
File Size, y
(MB)
60
180
240
540
600
What does the slope of the graph of this situation represent?
A. The increase in the file size of the video per minute of playing time
B. The file size of each video
C. The playing time of each video
D. The increase in the playing time per MB of video

Answers: 3


Other questions on the subject: Mathematics
Mathematics, 22.06.2019 02:50, makalanharrison
04.05 graphing exponential functions write an exponential function to represent the spread of bens social media post
Answers: 1
Mathematics, 22.06.2019 03:00, kolbehoneyman
Suppose that prices of a gallon of milk at various stores in one town have a mean of $3.71 with a standard deviation of $0.10. using chebyshev's theorem, what is the minimum percentage of stores that sell a gallon of milk for between $3.41 and $4.01? round your answer to one decimal place.
Answers: 2
Mathematics, 22.06.2019 05:30, carlosbs71
Number patterns 54, 18, 6, 2, 2/3, what are the next 2 terms?
Answers: 1
You know the right answer?
3.
The table shows the playing time in minutes of high-definition videos and the file size of thes...
Questions in other subjects:


Biology, 19.09.2020 01:01

Health, 19.09.2020 01:01
Mathematics, 19.09.2020 01:01

Physics, 19.09.2020 01:01
Mathematics, 19.09.2020 01:01


