
Mathematics, 27.04.2021 19:40 tayjay95
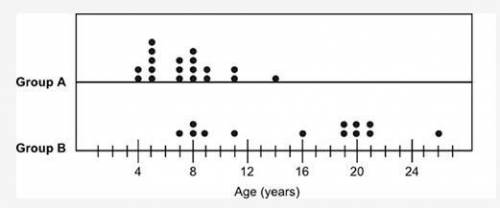
The ages of two groups of karate students are shown in the following dot plots:
picture shown below:
The mean absolute deviation (MAD) for group A is 2.07 and the MAD for group B is 5.51. Which of the following observations can be made using these data?
Group A has greater variability in the data.
Group A has less variability in the data.
Group B has a lower range.
Group B has a lower mean

Answers: 2


Other questions on the subject: Mathematics
Mathematics, 20.06.2019 18:04, marshalldayton1452
Which expression shows the result of applying the distributive property to 9(2+5m) 11 + 14m 18 + 45m 18 + 5m 2 + 45m
Answers: 1
Mathematics, 21.06.2019 19:00, cathyfrawley
Thee blue triangle has rotated from quadrant i to quadrant iii about the origin. describe the effects of the rotation on the coordinates of the blue triangle.
Answers: 3
You know the right answer?
The ages of two groups of karate students are shown in the following dot plots:
picture shown belo...
Questions in other subjects:

Mathematics, 06.11.2020 06:20

Chemistry, 06.11.2020 06:20

Physics, 06.11.2020 06:20
Mathematics, 06.11.2020 06:20


