10.
The lines graphed below show the amounts of water in two tanks as they were being
filled...

Mathematics, 27.04.2021 19:00 purplefish53
10.
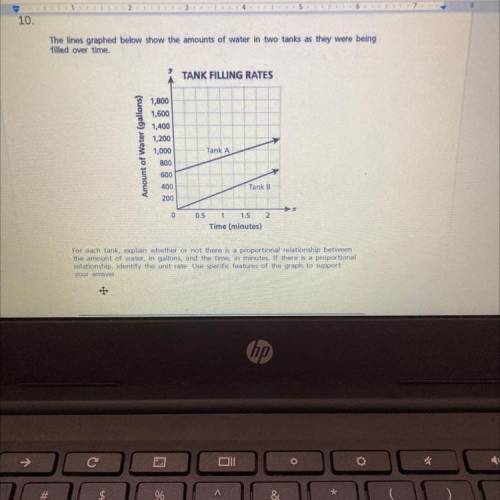
The lines graphed below show the amounts of water in two tanks as they were being
filled over time.
TANK FILLING RATES
+
Amount of Water (gallons)
1,800
1,600
1,400
1,200
1,000
800
600
400
200
Tank A
Tank B
0
0.5
1 1.5 2
Time (minutes)
For each tank, explain whether or not there is a proportional relationship between
the amount of water, in gallons, and the time, in minutes. If there is a proportional
relationship, identify the unit rate. Use specific features of the graph to support
your answer
hp

Answers: 1


Other questions on the subject: Mathematics
Mathematics, 21.06.2019 17:30, msdmdsm1186
Danielle earns a 7.25% commission on everything she sells at the electronics store where she works. she also earns a base salary of $750 per week. what were her sales last week if her total earnings for the week were $1,076.25?
Answers: 3
Mathematics, 21.06.2019 21:10, summer5716
Lines b and c are parallel. what is the measure of 2? m2 = 31° m2 = 50° m2 = 120° m2 = 130°
Answers: 2
You know the right answer?
Questions in other subjects:

Physics, 27.01.2020 06:31
Mathematics, 27.01.2020 06:31
SAT, 27.01.2020 06:31

Mathematics, 27.01.2020 06:31

Mathematics, 27.01.2020 06:31
Mathematics, 27.01.2020 06:31


