
Mathematics, 27.04.2021 18:30 kyleg1711
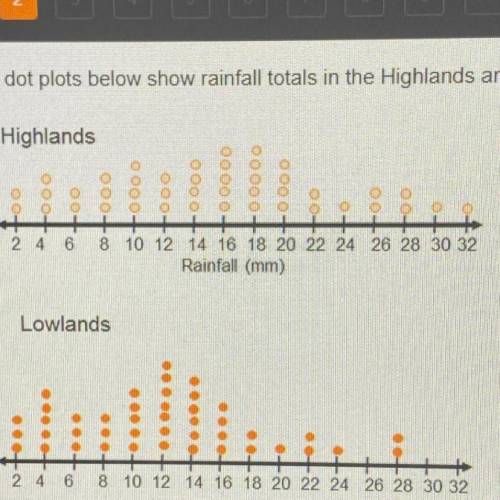
The dot plots below show rainfall totals in the Highlands and Lowlands areas of a certain region.
When comparing the two sets of data, which is a true statement?
A. there are gaps in both sets of data
B. The ranges are the same
C. The two sets of data do not overlap
D. The rainfall piece at a lower value in the low lands

Answers: 1


Other questions on the subject: Mathematics
Mathematics, 21.06.2019 20:10, kendall984
Right triangle xyz has a right angle at vertex y and a hypotenuse that measures 24 cm. angle zxy measures 70º. what is the length of line segment xy? round to the nearest tenth. 8.2 cm 8.7 cm 22.6 m 25.5 cm
Answers: 1
Mathematics, 21.06.2019 22:30, alliaespino
Awoman has 14 different shirts: 10 white shirts and 4 red shirts. if she randomly chooses 2 shirts to take with her on vacation, then what is the probability that she will choose two white shirts? show your answer in fraction and percent, round to the nearest whole percent.
Answers: 1
You know the right answer?
The dot plots below show rainfall totals in the Highlands and Lowlands areas of a certain region....
Questions in other subjects:
Mathematics, 03.12.2020 01:00

Physics, 03.12.2020 01:00
Mathematics, 03.12.2020 01:00


French, 03.12.2020 01:00
Mathematics, 03.12.2020 01:00

Arts, 03.12.2020 01:00
Mathematics, 03.12.2020 01:00
Mathematics, 03.12.2020 01:00


