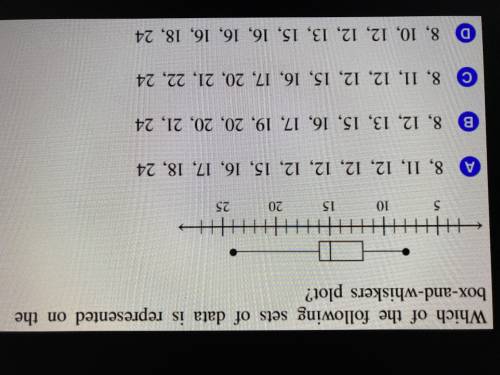
Which of the following sets of data is represented on the plot?
...

Mathematics, 27.04.2021 17:30 alyviariggins
Which of the following sets of data is represented on the plot?


Answers: 1


Other questions on the subject: Mathematics

Mathematics, 21.06.2019 17:10, sujeyribetanco2216
The average number of vehicles waiting in line to enter a parking lot can be modeled by the function f left parenthesis x right x squared over 2 left parenthesis 1 minus x right parenthesis endfraction , where x is a number between 0 and 1 known as the traffic intensity. find the rate of change of the number of vehicles waiting with respect to the traffic intensity for the intensities (a) xequals0.3 and (b) xequals0.6.
Answers: 1

Mathematics, 21.06.2019 21:10, ttrinityelyse17
The table below shows the approximate height of an object x seconds after the object was dropped. the function h(x)= -16x^2 +100 models the data in the table. for which value of x would this model make it the least sense to use? a. -2.75 b. 0.25 c. 1.75 d. 2.25
Answers: 2

Mathematics, 21.06.2019 22:00, hannahpalmario
The customer price index(cpi), which measures the cost of a typical package of customer goods, was 208.8 in 2011 and 244.1 in 2016.let x=11 corresponding to the year 2011 an estimate to cpi into 2013 and 2014. assume that the data can be modeled by a straight line and the trend to continue idenfinitely. use data points to find such a line and then estimate the requested quantities
Answers: 1

Mathematics, 21.06.2019 22:00, lokiliddel
In dire need~! describe how to use area models to find the quotient 2/3 divided by 1/5. check your work by also finding the quotient 2/3 divided by 1/5 using numerical operations only.
Answers: 3
You know the right answer?
Questions in other subjects:


Health, 25.07.2019 03:00


Biology, 25.07.2019 03:00


