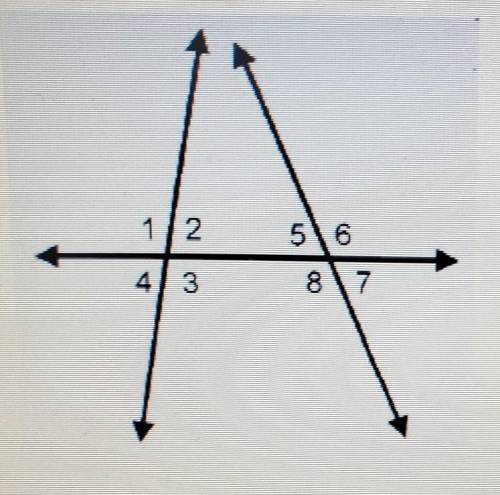
What is the measure of angle 7?
56
84
96
124
...

Mathematics, 27.04.2021 16:00 mattstudy305
What is the measure of angle 7?
56
84
96
124

Answers: 3


Other questions on the subject: Mathematics
Mathematics, 21.06.2019 14:20, hailey6822
Iam stuck on one problem. my mind is in absoloute vacation mode. i literallty just need to finish this to be done will give brainliest and all my points if i have to! 1- point free throw and 2- point feild goal. he made 35 shots, and scored 62 points how many of each shot did he make in 1 minute? (i already did the math. he made 8 1-point free throws and 27 2-point feild goals.) 1. write two equations for the problem. (i had a major brain fart.)
Answers: 1
Mathematics, 21.06.2019 16:00, kell22wolf
Part one: measurements 1. measure your own height and arm span (from finger-tip to finger-tip) in inches. you will likely need some from a parent, guardian, or sibling to get accurate measurements. record your measurements on the "data record" document. use the "data record" to you complete part two of this project. name relationship to student x height in inches y arm span in inches archie dad 72 72 ginelle mom 65 66 sarah sister 64 65 meleah sister 66 3/4 67 rachel sister 53 1/2 53 emily auntie 66 1/2 66 hannah myself 66 1/2 69 part two: representation of data with plots 1. using graphing software of your choice, create a scatter plot of your data. predict the line of best fit, and sketch it on your graph. part three: the line of best fit include your scatter plot and the answers to the following questions in your word processing document 1. 1. which variable did you plot on the x-axis, and which variable did you plot on the y-axis? explain why you assigned the variables in that way. 2. write the equation of the line of best fit using the slope-intercept formula $y = mx + b$. show all your work, including the points used to determine the slope and how the equation was determined. 3. what does the slope of the line represent within the context of your graph? what does the y-intercept represent? 5. use the line of best fit to you to describe the data correlation.
Answers: 2
Mathematics, 21.06.2019 17:40, PONBallfordM89
How can the correlation in the scatter plot graph below best be described? positive correlation negative correlation both positive and negative no correlation
Answers: 1
Mathematics, 21.06.2019 18:00, evanwall91
Need on this geometry question. explain how you did it.
Answers: 2
You know the right answer?
Questions in other subjects:

English, 23.03.2021 06:50
Mathematics, 23.03.2021 06:50
Engineering, 23.03.2021 06:50
Mathematics, 23.03.2021 06:50
Mathematics, 23.03.2021 06:50

Physics, 23.03.2021 06:50
Mathematics, 23.03.2021 06:50

Computers and Technology, 23.03.2021 06:50
Physics, 23.03.2021 06:50


