
Mathematics, 27.04.2021 08:30 jadalove45
Constant of proportionality from graphs
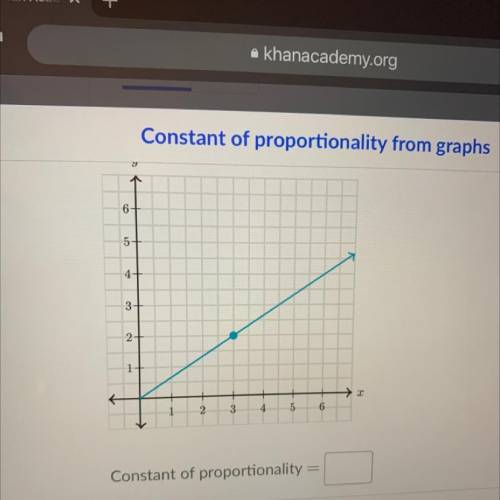
The following graph shows a proportional relationship.
What is the constant of proportionality between y and X
in the graph?

Answers: 1


Other questions on the subject: Mathematics
Mathematics, 20.06.2019 18:04, jamaicalove2880
The graph below shows the price of different numbers of mats at a store: a graph is shown. the values on the x axis are 0, 2, 4, 6, 8, 10. the values on the y axis are 0, 21, 42, 63, 84, and 105. points are shown on ordered pairs 0, 0 and 2, 21 and 4, 42 and 6, 63 and 8, 84. these points are connected by a line. the label on the x axis is number of mats. the title on the y axis is price in dollars. which equation can be used to determine p, the cost of b mats?
Answers: 3
Mathematics, 21.06.2019 16:20, mattmaddox86
The number of potato chips in a bag is normally distributed with a mean of 71 and a standard deviation of 2. approximately what percent of bags contain between 69 and 73 potato chips? approximately 68% approximately 71% approximately 95% approximately 99.7%
Answers: 2
Mathematics, 21.06.2019 22:50, karmaxnagisa20
3x = 729 solve for x plz . it's urgent. will mark
Answers: 2
You know the right answer?
Constant of proportionality from graphs
The following graph shows a proportional relationship.
Questions in other subjects:


Biology, 20.11.2020 01:00


Geography, 20.11.2020 01:00
Mathematics, 20.11.2020 01:00
Mathematics, 20.11.2020 01:00


