
Mathematics, 26.04.2021 22:00 ri069027
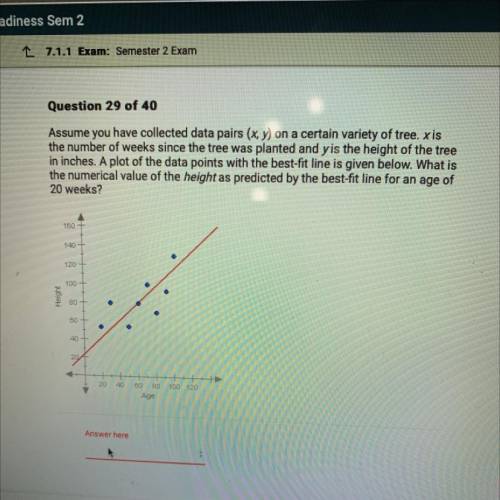
Assume you have collected data pairs (x, y) on a certain variety of tree. xis
the number of weeks since the tree was planted and y is the height of the tree
in inches. A plot of the data points with the best-fit line is given below. What is
the numerical value of the height as predicted by the best-fit line for an age of
20 weeks?

Answers: 2


Other questions on the subject: Mathematics
Mathematics, 21.06.2019 13:30, Packergood
34 cup. a serving of vegetable soup is 23 cup. the restaurant sold 20 servings of chicken noodle soup and 18 servings of vegetable soup. how many more cups of chicken noodle soup did they sell than cups of vegetable soup?
Answers: 2
Mathematics, 21.06.2019 17:30, cfnewton09
Astudent survey asked: "how tall are you (in inches)? " here's the data: 67, 72, 73, 60, 65, 86, 72, 69, 74 give the five number summary. a. median: 73, mean: 70.89, iqr: 5, min: 60, max: 74 b. 60, 66, 72, 73.5, 86 c. 60, 67, 72, 73, 74 d. 0, 60, 70, 89, 74, 100
Answers: 3
You know the right answer?
Assume you have collected data pairs (x, y) on a certain variety of tree. xis
the number of weeks...
Questions in other subjects:


