The scatter plot shows the
sale price of several food
items, y, and the cost of
the in...

Mathematics, 26.04.2021 20:50 emilio77100
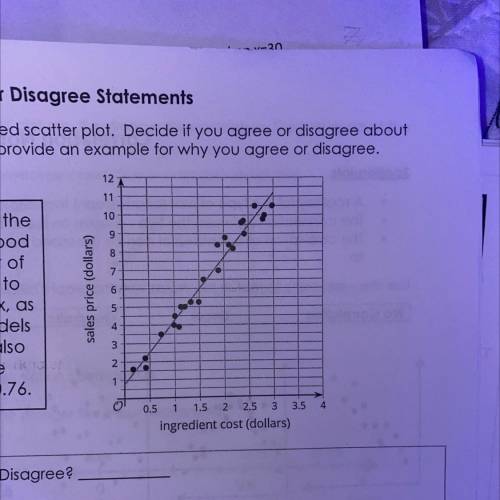
The scatter plot shows the
sale price of several food
items, y, and the cost of
the ingredients used to
produce those items, x, as
well as a line that models
the data. The line is also
represented by the
equation y = 3.48x + 0.76.
The predicted sale prince of an item that has ingredients that cost $1.50 is $5.25
Agree or disagree?
Explain:

Answers: 1


Other questions on the subject: Mathematics
Mathematics, 21.06.2019 15:20, ayoismeisalex
1-for what value of x is line a parallel to line b 2-for what value of x is line a parallel to line b
Answers: 1
Mathematics, 21.06.2019 20:00, dbn4everloved
Anyone? 15m is what percent of 60m; 3m; 30m; 1.5 km?
Answers: 1
Mathematics, 21.06.2019 23:00, sugar1014
According to a study conducted in 2015, 18% of shoppers said that they prefer to buy generic instead of name-brand products. suppose that in a recent sample of 1500 shoppers, 315 stated that they prefer to buy generic instead of name-brand products. at a 5% significance level, can you conclude that the proportion of all shoppers who currently prefer to buy generic instead of name-brand products is higher than .18? use both the p-value and the critical-value approaches.
Answers: 1
You know the right answer?
Questions in other subjects:

Mathematics, 31.07.2019 20:40

World Languages, 31.07.2019 20:40


Physics, 31.07.2019 20:40
Mathematics, 31.07.2019 20:50


