
The scatter plot shows the
sale price of several food
items, y, and the cost of
the in...

Mathematics, 26.04.2021 20:50 natalie2sheffield
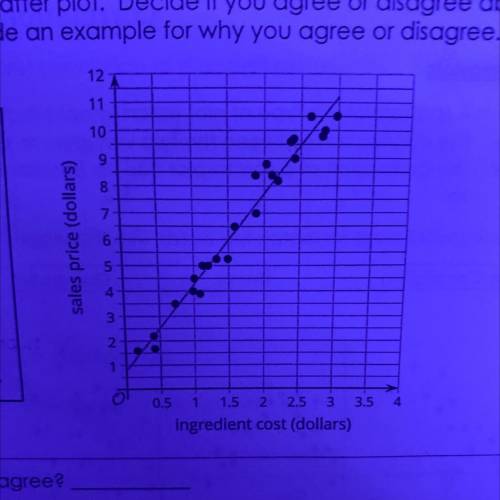
The scatter plot shows the
sale price of several food
items, y, and the cost of
the ingredients used to
produce those items, x, as
well as a line that models
the data. The line is also
represented by the
equation y = 3.48x + 0.76.
The predicted sale prince of an item that has ingredients that cost $1.50 is $5.25
Agree or disagree?
Explain:

Answers: 3


Other questions on the subject: Mathematics
Mathematics, 21.06.2019 16:30, catdog2230
Determine whether the quadrilateral below is a parallelogram. justify/explain your answer (this means back it up! give specific information that supports your decision. writing just "yes" or "no" will result in no credit.)
Answers: 2
Mathematics, 21.06.2019 21:30, ashleyprescot05
Find the missing dimension! need asap! tiny square is a =3025 in ²
Answers: 1
Mathematics, 22.06.2019 00:00, hotonkylie147
Which of the following will form the composite function?
Answers: 3
You know the right answer?
Questions in other subjects:

Mathematics, 19.11.2020 23:40


Chemistry, 19.11.2020 23:40
Mathematics, 19.11.2020 23:40


