
Mathematics, 26.04.2021 05:50 kxngtj3
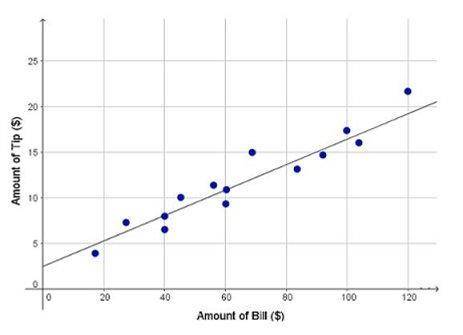
The graph shows the tip amount that 14 different customers left, based on their bill. A trend line has been drawn for the data. The equation for the line is: y = 0.14x + 2.5. Which BEST interprets the slope of the linear model?
A) A $1 increase in the bill is associated with a $2.50 increase in tip amount.
B) A $2.50 increase in the bill is associated with a $1 increase in tip amount.
C) A $0.14 increase in the bill is associated with a $1 increase in tip amount.
D) A $1 increase in the bill is associated with a $0.14 increase in tip amount.
The answer is D

Answers: 3


Other questions on the subject: Mathematics
Mathematics, 21.06.2019 19:30, Dillpickle3322
Si la base de un triángulo isósceles mide 70 m y el ángulo opuesto a ésta mide 58°; entonces ¿cuánto mide la altura de dicho triángulo? a) 21.87 m. b) 40.01 m. c) 43.74 m. d) 63.14 m.
Answers: 1
Mathematics, 22.06.2019 02:30, EBeast7390
In one month jillian made 36 local phone calls and 20 long-distance calls what was her ratio of local calls to long-distance calls for that month?
Answers: 1
Mathematics, 22.06.2019 05:00, maxicanofb0011
Akindergarten class has 9 girls and 11 boys in class. what percent of the class are girlsit rain
Answers: 1
You know the right answer?
The graph shows the tip amount that 14 different customers left, based on their bill. A trend line h...
Questions in other subjects:
Mathematics, 20.09.2021 14:00


Mathematics, 20.09.2021 14:00
Mathematics, 20.09.2021 14:00


