
Mathematics, 25.04.2021 22:00 hjohnsonn102010
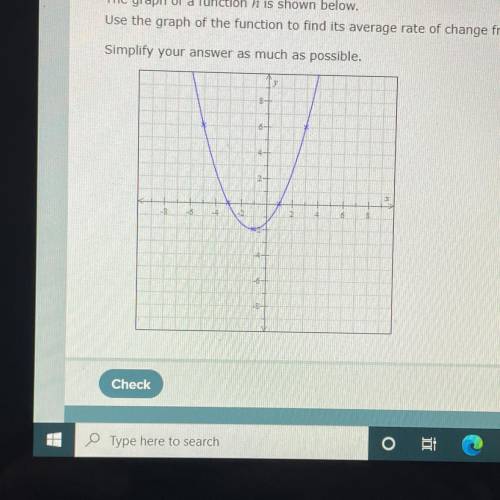
The graph of a function h is shown below.
Use the graph of the function to find its average rate of change from x= -1 to x= 3.
Simplify your answer as much as possible.

Answers: 1


Other questions on the subject: Mathematics
Mathematics, 21.06.2019 14:40, beebeck6573
Chose the graph below that represents the following system of inequality’s
Answers: 2
Mathematics, 21.06.2019 16:20, tmantooth7018
The lengths of nails produced in a factory are normally distributed with a mean of 4.91 centimeters and a standard deviation of 0.05 centimeters. find the two lengths that separate the top 4% and the bottom 4%. these lengths could serve as limits used to identify which nails should be rejected. round your answer to the nearest hundredth, if necessary.
Answers: 3
Mathematics, 21.06.2019 20:00, soniah
Pepe and leo deposits money into their savings account at the end of the month the table shows the account balances. if there pattern of savings continue and neither earns interest nor withdraw any of the money , how will the balance compare after a very long time ?
Answers: 1
You know the right answer?
The graph of a function h is shown below.
Use the graph of the function to find its average rate...
Questions in other subjects:

Mathematics, 18.07.2019 08:20
Mathematics, 18.07.2019 08:20

Biology, 18.07.2019 08:20

History, 18.07.2019 08:20
History, 18.07.2019 08:20

English, 18.07.2019 08:20
Mathematics, 18.07.2019 08:20


