PLEASE HELP
Select ALL the correct answers.
The histogram below shows the number of goals sc...

Mathematics, 25.04.2021 21:20 Queenofpizza
PLEASE HELP
Select ALL the correct answers.
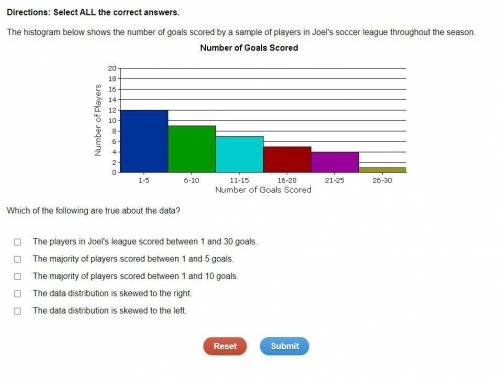
The histogram below shows the number of goals scored by a sample of players in Joel's soccer league throughout the season.
Which of the following are true about the data?
The players in Joel's league scored between 1 and 30 goals.
The majority of players scored between 1 and 5 goals.
The majority of players scored between 1 and 10 goals.
The data distribution is skewed to the right.
The data distribution is skewed to the left.

Answers: 2


Other questions on the subject: Mathematics
Mathematics, 21.06.2019 18:30, lethycialee79711
What is the result of converting 60 ounces to pounds remember there are 16 ounces in a pound
Answers: 2
Mathematics, 21.06.2019 20:30, kcarstensen59070
Solve each quadratic equation by factoring and using the zero product property. 10x + 6 = -2x^2 -2
Answers: 2
Mathematics, 21.06.2019 21:00, animexcartoons209
With alll of except for the 2 that i did already
Answers: 1
You know the right answer?
Questions in other subjects:
Mathematics, 20.12.2020 14:00

English, 20.12.2020 14:00
Mathematics, 20.12.2020 14:00

Chemistry, 20.12.2020 14:00
Mathematics, 20.12.2020 14:00


