
Mathematics, 25.04.2021 04:50 josie122
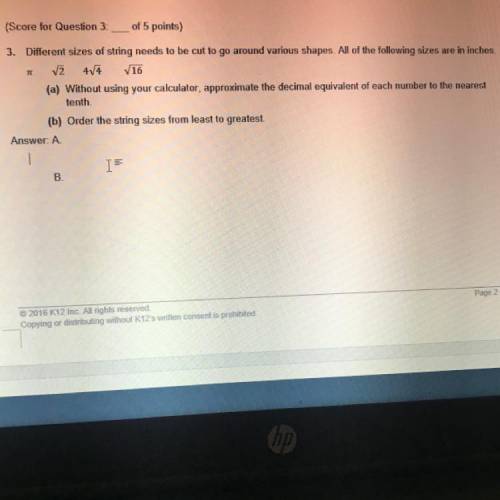
Different sizes of string needs to be cut to go around various shapes. All of the following sizes are in inches
2 44 16
(a) Without using your calculator, approximate the decimal equivalent of each number to the nearest
tenth
(b) Order the string sizes from least to greatest

Answers: 1


Other questions on the subject: Mathematics
Mathematics, 21.06.2019 21:10, verdolaga2017me
What is the domain of the given function? {(3,-2), (6, 1), (-1, 4), (5,9), (-4, 0); o {x | x= -4,-1, 3, 5, 6} o {yl y = -2,0, 1,4,9} o {x|x = -4,-2, -1,0, 1, 3, 4, 5, 6, 9} o y y = 4,-2, -1, 0, 1, 3, 4, 5, 6, 9}
Answers: 1
Mathematics, 21.06.2019 22:00, juhavyen
Determine the domain and range of the given function. the domain is all real numbers all real numbers greater than or equal to –2{x: x = –2, –1, 0, 1, 2}{y: y = –2, –1, 0, 1, 2}. the range is all real numbers all real numbers greater than or equal to –2{x: x = –2, –1, 0, 1, 2}{y: y = –2, –1, 0, 1, 2}.
Answers: 1
Mathematics, 22.06.2019 02:30, misk980
Atrain traveled for 1.5 hours to the first station, stopped for 30 minutes, then traveled for 4 hours to the final station where it stopped for 1 hour. the total distance traveled is a function of time. which graph most accurately represents this scenario? a graph is shown with the x-axis labeled time (in hours) and the y-axis labeled total distance (in miles). the line begins at the origin and moves upward for 1.5 hours. the line then continues upward at a slow rate until 2 hours. from 2 to 6 hours, the line continues quickly upward. from 6 to 7 hours, it moves downward until it touches the x-axis a graph is shown with the axis labeled time (in hours) and the y axis labeled total distance (in miles). a line is shown beginning at the origin. the line moves upward until 1.5 hours, then is a horizontal line until 2 hours. the line moves quickly upward again until 6 hours, and then is horizontal until 7 hours a graph is shown with the axis labeled time (in hours) and the y-axis labeled total distance (in miles). the line begins at the y-axis where y equals 125. it is horizontal until 1.5 hours, then moves downward until 2 hours where it touches the x-axis. the line moves upward until 6 hours and then moves downward until 7 hours where it touches the x-axis a graph is shown with the axis labeled time (in hours) and the y-axis labeled total distance (in miles). the line begins at y equals 125 and is horizontal for 1.5 hours. the line moves downward until 2 hours, then back up until 5.5 hours. the line is horizontal from 5.5 to 7 hours
Answers: 1
You know the right answer?
Different sizes of string needs to be cut to go around various shapes. All of the following sizes ar...
Questions in other subjects:


Mathematics, 27.01.2020 18:31


