
Mathematics, 25.04.2021 02:20 yeimi12
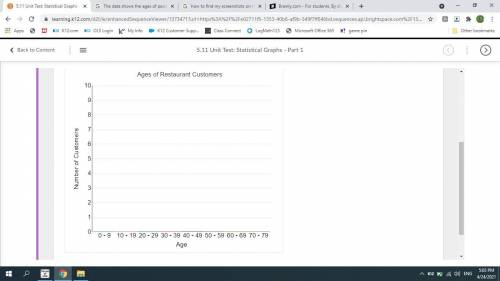
The data shows the ages of people in a restaurant.
20, 25, 5, 28, 66, 62, 21, 28, 34, 38, 40, 10, 12, 15, 45, 50, 28
Create a histogram of this data.
To create a histogram, hover over each age range on the x-axis. Then click and drag up to plot the data.

Answers: 3


Other questions on the subject: Mathematics
Mathematics, 21.06.2019 23:50, tatibean26
The functions f(x) and g(x) are shown in the graph f(x)=x^2 what is g(x) ?
Answers: 2
You know the right answer?
The data shows the ages of people in a restaurant.
20, 25, 5, 28, 66, 62, 21, 28, 34, 38, 40, 10,...
Questions in other subjects:

Mathematics, 08.12.2020 19:00

Social Studies, 08.12.2020 19:00
Mathematics, 08.12.2020 19:00
Mathematics, 08.12.2020 19:00
Mathematics, 08.12.2020 19:00


