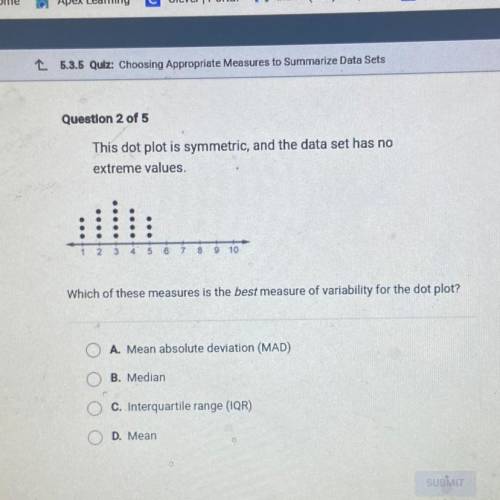
This dot plot is symmetric, and the data set has no
extreme values.
2 3 4 5 6
9 10
Which of these measures is the best measure of variability for the dot plot?
A. Mean absolute deviation (MAD)
B. Median
OOO
C. Interquartile range (IQR)
D. Mean
Students at a high school were asked about their favorite outdoor activity. the results are shown in the two-way frequency table below. fishing camping canoeing skiing total boys 36 44 13 25 118 girls 34 37 22 20 113 total 70 81 35 45 231 select all the statements that are true based on the given table. more girls chose camping as their favorite outdoor activity than boys. more girls chose canoeing as their favorite outdoor activity than those who chose skiing. more boys chose skiing as their favorite outdoor activity than girls. there were more boys surveyed than girls. twice as many students chose canoeing as their favorite outdoor activity than those who chose fishing. more students chose camping as their favorite outdoor activity than the combined number of students who chose canoeing or skiing.
Candice uses the function f(t)=t+100−−−−−−√ to model the number of students in her after-school program. the variable t represents days and f(t) represents the number of students. how many days does it take for there to be 15 students in her program? a. 225 days b. 125 days c. 325 days d. 115 days