
Mathematics, 24.04.2021 14:00 adyenamaie02
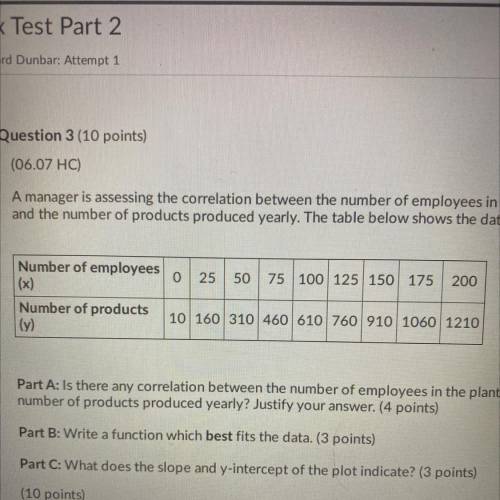
A manager is assessing the correlation between the number of employees in a plant
and the number of products produced yearly. The table below shows the data:
Part A: Is there any correlation between the number of employees in the plant and the
number of products produced yearly? Justify your answer. (4 points)
Part B: Write a function which best fits the data. (3 points)
Part C: What does the slope and y-intercept of the plot indicate? (3 points)

Answers: 3


Other questions on the subject: Mathematics
Mathematics, 21.06.2019 20:00, Chen5968
The distribution of the amount of money spent by students for textbooks in a semester is approximately normal in shape with a mean of $235 and a standard deviation of $20. according to the standard deviation rule, how much did almost all (99.7%) of the students spend on textbooks in a semester?
Answers: 2
Mathematics, 21.06.2019 21:00, zalyndevola
Solve this problem! extra ! 3025/5.5 = a/90.75 / = fraction
Answers: 3
You know the right answer?
A manager is assessing the correlation between the number of employees in a plant
and the number o...
Questions in other subjects:

Mathematics, 09.04.2020 11:06

Chemistry, 09.04.2020 11:07

Biology, 09.04.2020 11:07

Geography, 09.04.2020 11:07
Biology, 09.04.2020 11:07
Mathematics, 09.04.2020 11:07


