
Mathematics, 23.04.2021 22:10 estermartinez
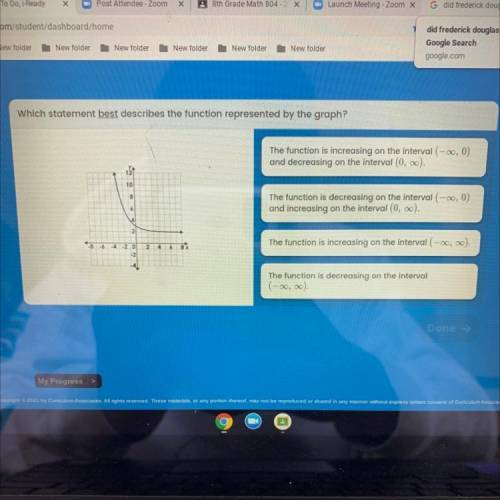
Which statement best describes the function represented by the graph?
The function is increasing on the interval (-2, 0)
and decreasing on the interval (0, 0).
10
8
The function is decreasing on the interval (-0, 0)
and increasing on the interval (0.00).
6
2
The function is increasing on the interval (-0, 0).
2 4 6 8
-4-20
-2
4
The function is decreasing on the interval
(-00, 00
My Progress

Answers: 2


Other questions on the subject: Mathematics
Mathematics, 21.06.2019 18:00, edgarsandoval60
What is the equation of this graphed line? enter your answer in slope-intercept form in the box.
Answers: 2
Mathematics, 21.06.2019 18:50, beeboppity
7. the area of the playing surface at the olympic stadium in beijing isof a hectare. what area will it occupy on a plan drawn to a scaleof 1: 500?
Answers: 3
Mathematics, 22.06.2019 01:30, jude40
Asample of 200 rom computer chips was selected on each of 30 consecutive days, and the number of nonconforming chips on each day was as follows: the data has been given so that it can be copied into r as a vector. non. conforming = c(10, 15, 21, 19, 34, 16, 5, 24, 8, 21, 32, 14, 14, 19, 18, 20, 12, 23, 10, 19, 20, 18, 13, 26, 33, 14, 12, 21, 12, 27) #construct a p chart by using the following code. you will need to enter your values for pbar, lcl and ucl. pbar = lcl = ucl = plot(non. conforming/200, ylim = c(0,.5)) abline(h = pbar, lty = 2) abline(h = lcl, lty = 3) abline(h = ucl, lty = 3)
Answers: 3
You know the right answer?
Which statement best describes the function represented by the graph?
The function is increasing o...
Questions in other subjects:


Mathematics, 06.01.2022 05:10


