
Mathematics, 23.04.2021 21:00 oseniiyabode123
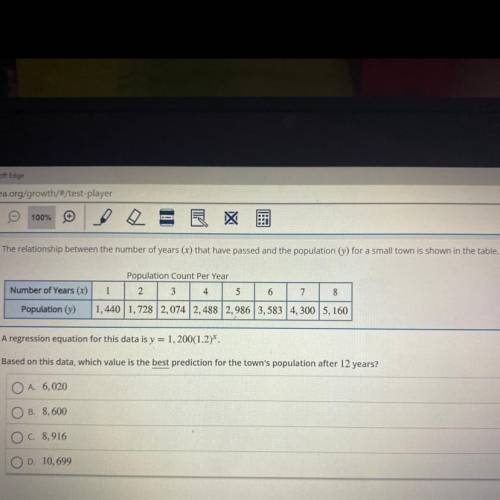
The relationship between the number of years (x) that have passed and the population (y) for a small town is shown in the table.
Population Count Per Year
2 3 4
Number of Years (x)
5
6
7
8
Population ()
1,440 1,7282,0742,488 2,986 3,583 4,300 5,160
A regression equation for this data is y = 1, 200(1.2)*.
Based on this data, which value is the best prediction for the town's population after 12 years?
O A. 6,020
B. 8,600
C. 8,916
D. 10,699

Answers: 1


Other questions on the subject: Mathematics
You know the right answer?
The relationship between the number of years (x) that have passed and the population (y) for a small...
Questions in other subjects:
Mathematics, 07.11.2020 02:40

Social Studies, 07.11.2020 02:40
Mathematics, 07.11.2020 02:40


Arts, 07.11.2020 02:40

Mathematics, 07.11.2020 02:40


