
Mathematics, 23.04.2021 18:50 asdf334asdf334
PLZ ANSWER THIS IS 10 DAYS LATE!!!
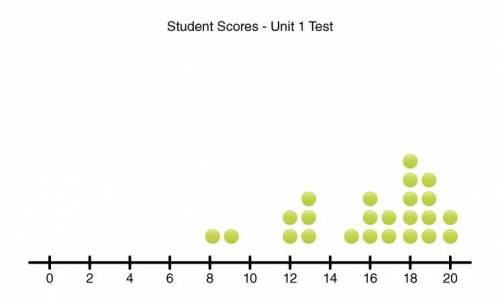
The following dot plot represents student scores on the Unit 1 math test. Scores are in whole number increments.
For this data set, the value of the range is about (Choose...) the value of the interquartile range.
On average, the data points lie between (Choose...) points from the mean.

Answers: 1


Other questions on the subject: Mathematics
Mathematics, 21.06.2019 20:30, ellie55991
Graph the line that represents a proportional relationship between d and t with the property that an increase of 33 units in t corresponds to an increase of 44 units in d. what is the unit rate of change of dd with respect to t? (that is, a change of 11 unit in t will correspond to a change of how many units in d? )
Answers: 3
Mathematics, 21.06.2019 21:40, arubright177
The tile along the edge of a triangular community pool needs to be replaced? ?
Answers: 2
Mathematics, 21.06.2019 22:00, sebcbal
The mean finish time was 185.52 with a standard deviation of 0.327 minute. the winning car driven by chris finished in 185.13. the previous year race had a mean finish time of 110.3 with a standard deviation of 0.106. the winning car that year driven by karen finished in 110.13 minutes. find their respective z-scores. chris - z-score karen “- z-score
Answers: 1
Mathematics, 21.06.2019 23:00, erbnichole
Graph the system of equations on your graph paper to answer the question. {y=−x+4y=x−2 what is the solution for the system of equations? enter your answer in the boxes.
Answers: 1
You know the right answer?
PLZ ANSWER THIS IS 10 DAYS LATE!!!
The following dot plot represents student scores on the Unit 1...
Questions in other subjects:


Social Studies, 19.09.2020 01:01

Computers and Technology, 19.09.2020 01:01


World Languages, 19.09.2020 01:01


Biology, 19.09.2020 01:01
Mathematics, 19.09.2020 01:01


