
Mathematics, 23.04.2021 18:30 reagancunningham2004
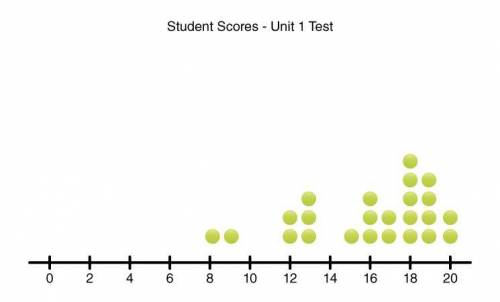
The following dot plot represents student scores on the Unit 1 math test. Scores are in whole number increments.
For this data set, the value of the range is about (Choose...) the value of the interquartile range.
On average, the data points lie between (Choose...) points from the mean.

Answers: 3


Other questions on the subject: Mathematics
Mathematics, 21.06.2019 14:50, Felicitybuckman
What is the square root of 45? (step by step working plz)
Answers: 1
Mathematics, 21.06.2019 15:40, connorgking
What term best describes a line ans a point that lie in the same plane
Answers: 3
Mathematics, 21.06.2019 22:30, NearNoodle23
Meghan has created a diagram of her city with her house, school, store, and gym identified. a. how far is it from the gym to the store? b. meghan also wants to walk to get some exercise, rather than going to the gym. she decides to walk along arc ab. how far will she walk? round to 3 decimal places.
Answers: 1
You know the right answer?
The following dot plot represents student scores on the Unit 1 math test. Scores are in whole number...
Questions in other subjects:


Mathematics, 12.03.2021 19:20
Mathematics, 12.03.2021 19:20
Biology, 12.03.2021 19:20

Mathematics, 12.03.2021 19:20


