
Mathematics, 23.04.2021 17:10 dtaylor7755
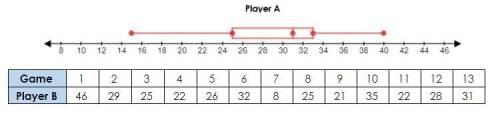
The box plot and table below represents data on the amount of points scored per game for two players, Player A and Player B, in their last 13 games in the 2019 NBA Playoffs. If you were the general manager of a basketball team, which player would you want on your team and why? Explain your choice by comparing measures of center and spread.

Answers: 3


Other questions on the subject: Mathematics
Mathematics, 21.06.2019 19:00, Patricia2121
Me with geometry ! in this figure, bc is a perpendicular bisects of kj. dm is the angle bisects of bdj. what is the measure of bdm? •60° •90° •30° •45°
Answers: 2
Mathematics, 21.06.2019 20:00, CelesteN64
For problems 29 - 31 the graph of a quadratic function y=ax^2 + bx + c is shown. tell whether the discriminant of ax^2 + bx + c = 0 is positive, negative, or zero.
Answers: 1
Mathematics, 21.06.2019 21:40, lineaeriksen
Ineed your ! i was to turn this into pond first thing i gotta do is outline the inside with this plastic how big should i cut the plastic the height: 10 1/2” the length: 40” the width: 12” me !
Answers: 1
You know the right answer?
The box plot and table below represents data on the amount of points scored per game for two players...
Questions in other subjects:
Mathematics, 03.04.2020 22:39


Mathematics, 03.04.2020 22:39

Chemistry, 03.04.2020 22:39


