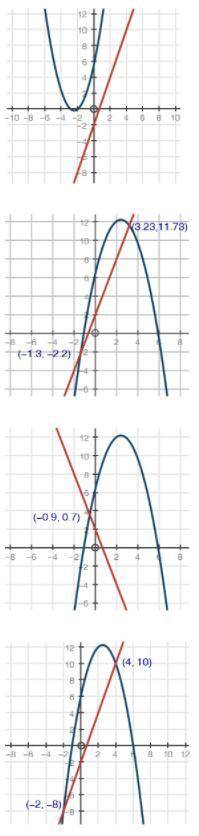
Which of the graphs below correctly solve for x in the equation −x2 + 5x + 6 = 3x − 2?
...

Mathematics, 23.04.2021 07:40 sonyarucker
Which of the graphs below correctly solve for x in the equation −x2 + 5x + 6 = 3x − 2?

Answers: 3


Other questions on the subject: Mathematics
Mathematics, 21.06.2019 18:00, cashhd1212
The given dot plot represents the average daily temperatures, in degrees fahrenheit, recorded in a town during the first 15 days of september. if the dot plot is converted to a box plot, the first quartile would be drawn at __ , and the third quartile would be drawn at __ link to graph: .
Answers: 1
Mathematics, 21.06.2019 20:00, amylumey2005
Wich statement could be used to explain why the function h(x)= x^3 has an inverse relation that is also a function
Answers: 3
You know the right answer?
Questions in other subjects:
Mathematics, 18.12.2020 01:00


Advanced Placement (AP), 18.12.2020 01:00

Spanish, 18.12.2020 01:00


Arts, 18.12.2020 01:00
Mathematics, 18.12.2020 01:00


