
Mathematics, 23.04.2021 06:50 hanjonez
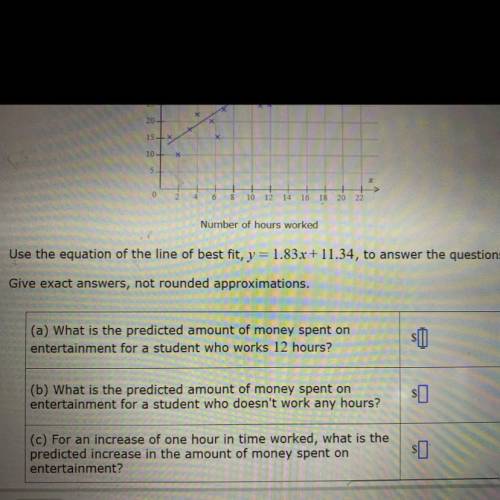
The scatter plot shows the number of hours worked, x, and the amount of money spent on entertainment, y, by each of 25 students.
55
50
45-
401
352
Amount of
money spent on
entertainment
(in dollars)
X
30
25
20-
15+
10+
5
0
2
10 12 14 16 18 20 22
Number of hours worked
Use the equation of the line of best fit, y = 1.83x + 11.34, to answer the questions below.

Answers: 2


Other questions on the subject: Mathematics
Mathematics, 21.06.2019 15:30, vetterk1400
What is the measure of angle z in this figure? enter your answer in the box. z = ° two intersection lines. all four angles formed by the intersecting lines are labeled. clockwise, the angles are labeled 43 degrees, x degrees, y degrees, and z degrees.
Answers: 3
Mathematics, 21.06.2019 16:00, sierravick123owr441
Brent needs to paint a logo made using two right triangles. the dimensions of the logo are shown below. what is the difference between the area of the large triangle and the area of the small triangle? (1 point) select one: a. 4.5 cm2 b. 8.5 cm2 c. 16.5 cm2 d. 33.0 cm2
Answers: 1
Mathematics, 21.06.2019 17:00, Niyah3406
When you are making a circle graph by hand, how do you convert a number for a part into its corresponding angle measure in the circle graph? when you are making a circle graph by hand, what should you do if one of your angle measures is greater than 180°?
Answers: 2
Mathematics, 21.06.2019 19:00, amayareyes101
What are the solutions of the equation? z^2 + 11z + 24 = 0 a. 8, -3 b. 8, 3 c. -8, -3 d. -8, 3
Answers: 2
You know the right answer?
The scatter plot shows the number of hours worked, x, and the amount of money spent on entertainment...
Questions in other subjects:

Computers and Technology, 17.12.2019 10:31


History, 17.12.2019 10:31

Spanish, 17.12.2019 10:31
Social Studies, 17.12.2019 10:31
Mathematics, 17.12.2019 10:31

History, 17.12.2019 10:31
Mathematics, 17.12.2019 10:31


