
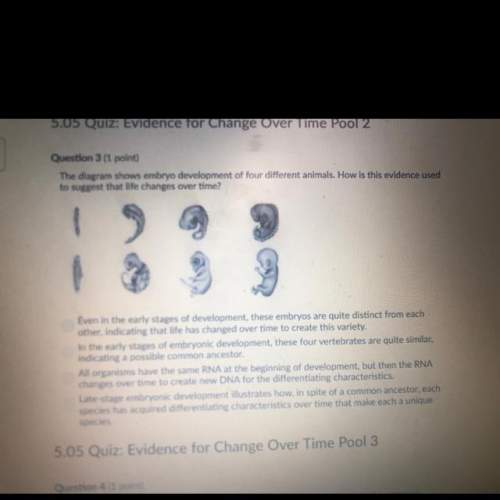
Mathematics, 23.04.2021 06:40 heidiallen565
What is wrong with this dot plot? The range should be from 0 to 10. There is no data shown for scores of 8. The gap between 3 and 7 is not shown. Nothing; the dot plot is correct.

Answers: 3


Other questions on the subject: Mathematics
Mathematics, 21.06.2019 22:40, GodlyGamer8239
20.ju inces. which ordered pair is a viable solution if x represents the number of books he orders and y represents the total weight of the books, in ounces? (-3,-18) (-0.5, -3) (0,0) (0.5, 3)
Answers: 1
Mathematics, 22.06.2019 00:20, kaliyab191
Four equations are shown below. equation 1: y=2*equation 2: y=2x-5equation 3: y=x2 + 6equation 4: tdentify one linear equation and one nonlinear equation from the list. why each equation you identified is linear or nonlinear. nd one nonlinear equation from the list. state a reasonlinear equation
Answers: 2
You know the right answer?
What is wrong with this dot plot? The range should be from 0 to 10. There is no data shown for score...
Questions in other subjects:
Mathematics, 11.12.2020 08:30


English, 11.12.2020 08:30
Mathematics, 11.12.2020 08:30
Mathematics, 11.12.2020 08:30
Mathematics, 11.12.2020 08:30
Mathematics, 11.12.2020 08:30
Mathematics, 11.12.2020 08:30


