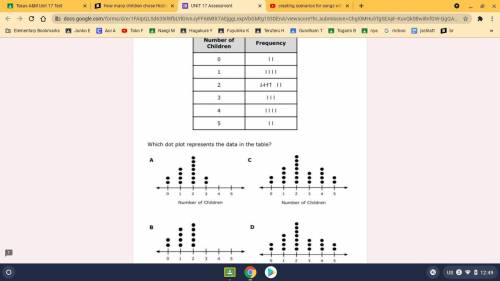
Which dot plot represents the data in the table?
...

Mathematics, 22.04.2021 21:10 twiddleturd
Which dot plot represents the data in the table?

Answers: 3


Other questions on the subject: Mathematics
Mathematics, 21.06.2019 14:30, igtguith
Brent works part-time at a clothing store. he earns an hourly wage of $15. if he needs to earn more than $45 in a day and works for x hours a day, which inequality represents this situation? a. 15x > 45 b. 15x < 60 c. x > 60 d. 15x < 45 e. x < 60
Answers: 1
Mathematics, 21.06.2019 17:30, Misspaige5150
17 in long 1.3 ft wide and 8in high what is the volume
Answers: 1
Mathematics, 22.06.2019 01:30, joytheqt305
Arecent study focused on the number of times men and women who live alone buy take-out dinner in a month. assume that the distributions follow the normal probability distribution and the population standard deviations are equal. the information is summarized below. statistic men women sample mean 24.85 21.33 sample standard deviation 5.54 4.93 sample size 34 36 at the 0.01 significance level, is there a difference in the mean number of times men and women order take-out dinners in a month? state the decision rule for 0.01 significance level: h0: μmen= μwomen h1: μmen ≠ μwomen. (negative amounts should be indicated by a minus sign. round your answers to 3 decimal places.) compute the value of the test statistic. (round your answer to 3 decimal places.) what is your decision regarding the null hypothesis? what is the p-value? (round your answer to 3 decimal places.)
Answers: 1
You know the right answer?
Questions in other subjects:


English, 08.12.2020 01:10

History, 08.12.2020 01:10
History, 08.12.2020 01:10
Mathematics, 08.12.2020 01:10
Mathematics, 08.12.2020 01:10
English, 08.12.2020 01:10


