
Mathematics, 22.04.2021 20:00 jynaepooh
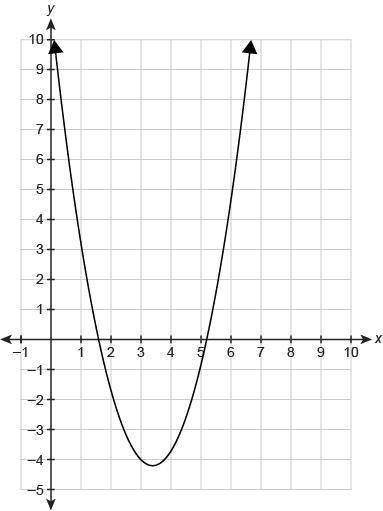
The graph shows the function f(x).
Which value is closest to the average rate of change from x = 1 to x = 3?
−3.5 - I know that this is the answer
−2.3 -
−2.3
−1.8
−0.3 -
i know that the answer is -3.5 but i need someone to explain the steps please

Answers: 3


Other questions on the subject: Mathematics
Mathematics, 21.06.2019 23:40, haybales6019
Cos^2x+cos^2(120°+x)+cos^2(120°-x)i need this asap. pls me
Answers: 1
Mathematics, 22.06.2019 06:00, Valentinavr
Paul bakes raisin bars in a pan shaped like a rectangular prism. the volume of the pan is 252 cubic inches. the length of the pan is 12 inches, and its width is 10 1/2 inches. what is the height of the pan? enter your answer in the box. will give brialist and pointsss !
Answers: 1
You know the right answer?
The graph shows the function f(x).
Which value is closest to the average rate of change from x = 1...
Questions in other subjects:

Mathematics, 03.11.2019 01:31
Mathematics, 03.11.2019 01:31


Mathematics, 03.11.2019 01:31


