LT 1 Alterative Assessment
Name
1. The dotplot below displays data on the number of siblings...

Mathematics, 22.04.2021 17:20 henrymototero
LT 1 Alterative Assessment
Name
1. The dotplot below displays data on the number of siblings reported by each student in a
statistics class
a Describe the shape of the distribution
TCNUSUNOY
Dot Pot
b. Describe the center of the distribution
2
5
7
4
Siblings
c. Describe the spread of the distribution
d. Identify any potential outliers.

Answers: 1


Other questions on the subject: Mathematics
Mathematics, 21.06.2019 17:20, psychocatgirl1
Which system of linear inequalities is represented by the graph? + l tv x-3y > 6 and y > 2x o x + 3y > 6 and y o x-3y > 6 and y> 2x o x + 3y > 6 and y > 2x + 4 la +
Answers: 1
Mathematics, 21.06.2019 21:40, Blakemiller2020
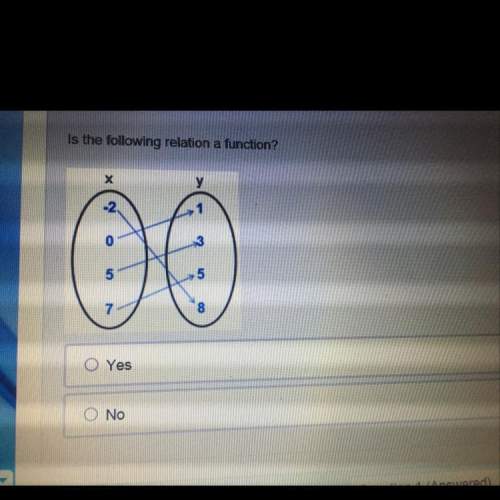
Which of the following best describes the graph below? + + 2 + 3 + 4 1 o a. it is not a function. o b. it is a one-to-one function. o c. it is a many-to-one function. o d. it is a function, but it is not one-to-one.
Answers: 3
You know the right answer?
Questions in other subjects:
Mathematics, 05.02.2023 02:40
Mathematics, 05.02.2023 02:40
Mathematics, 05.02.2023 02:50
Mathematics, 05.02.2023 03:10
Mathematics, 05.02.2023 03:20

Biology, 05.02.2023 04:00

Physics, 05.02.2023 04:40


