
Mathematics, 22.04.2021 16:30 gomezyonathan93
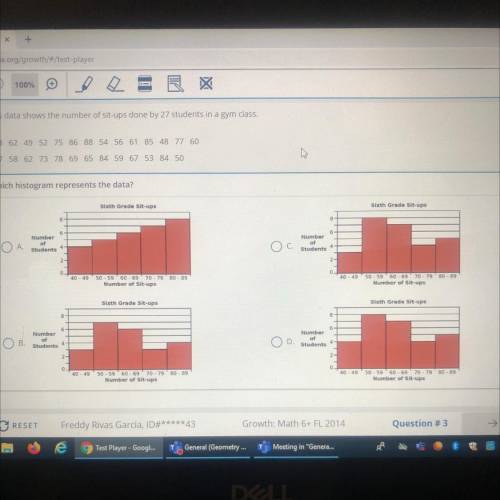
This data shows the number of sit-ups done by 27 students in a gym class.
58 62 49 52 75 86 88 54 56 61 85 48 77 60
47 58 62 73 78 69 65 84 59 67 53 84 50
Which histogram represents the data?

Answers: 1


Other questions on the subject: Mathematics
Mathematics, 22.06.2019 00:00, minecraftsam2018
What is the effect on the graph of the function f(x) = x2 when f(x) is changed to f(x) − 4?
Answers: 1
Mathematics, 22.06.2019 03:00, adrianVocke5685
The blue segment below is a diameter of o. what is the length of the radius of the circle?
Answers: 1
You know the right answer?
This data shows the number of sit-ups done by 27 students in a gym class.
58 62 49 52 75 86 88 54...
Questions in other subjects:
Mathematics, 23.09.2019 04:50
Mathematics, 23.09.2019 04:50

Advanced Placement (AP), 23.09.2019 04:50


Mathematics, 23.09.2019 05:00


