
Mathematics, 21.04.2021 22:40 jujudad0ll
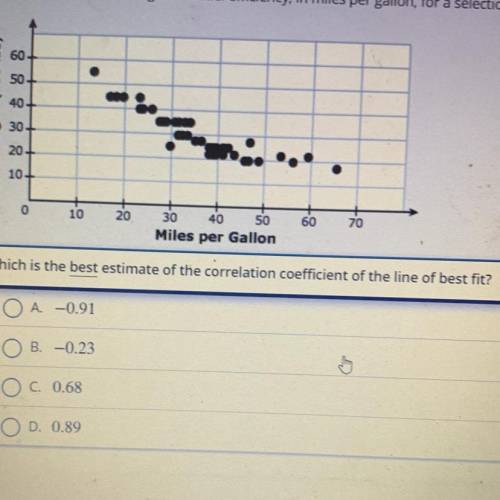
The graph shows the weight and fuel efficiency, in miles per gallon, for a selection of vehicles.
Which is the best estimate of the correlation coefficient of the line of best fit?
A. -0.91
B. -0.23
C. 0.68
D. 0.89

Answers: 1


Other questions on the subject: Mathematics
Mathematics, 22.06.2019 01:30, zitterkoph
The box plots show the distributions of the numbers of words per line in an essay printed in two different fonts.which measure of center would be best to compare the data sets? the median is the best measure because both distributions are left-skewed.the mean is the best measure because both distributions are left-skewed.the median is the best measure because both distributions are symmetric.the mean is the best measure because both distributions are symmetric
Answers: 1
Mathematics, 22.06.2019 02:50, QueenNerdy889
Atourist boat is used for sightseeing in a nearby river. the boat travels 2.4 miles downstream and in the same amount of time, it travels 1.8 miles upstream. if the boat travels at an average speed of 21 miles per hour in the still water, find the current of the river.
Answers: 2
Mathematics, 22.06.2019 06:00, liyahheadhigh
This is my question: kate has 4 and 3-eighths yards of fabric and needs 2 and 7-eighths yards to make a skirt. how much extra fabric will she have left after making the skirt?
Answers: 3
Mathematics, 22.06.2019 06:00, Arealbot
Achild has a box full of colored building blocks. she will choose one block without looking. the odds against choosing a blue block are 4/7. what is the probability of choosing a blue block? amanda is playing a role-playing game with her friends. she will roll dice to determine if her character unlocks a treasure chest. the probability of her character unlocking the treasure chest is 13/20. find the odds in favor of her character unlocking the treasure chest.
Answers: 1
You know the right answer?
The graph shows the weight and fuel efficiency, in miles per gallon, for a selection of vehicles....
Questions in other subjects:


Biology, 24.03.2020 21:35

English, 24.03.2020 21:35

Chemistry, 24.03.2020 21:35

Mathematics, 24.03.2020 21:35


