
Mathematics, 21.04.2021 21:20 alexkoval1231
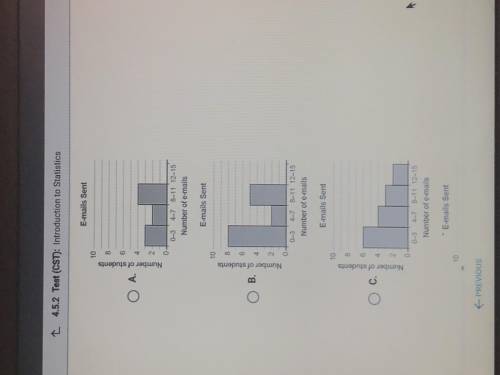
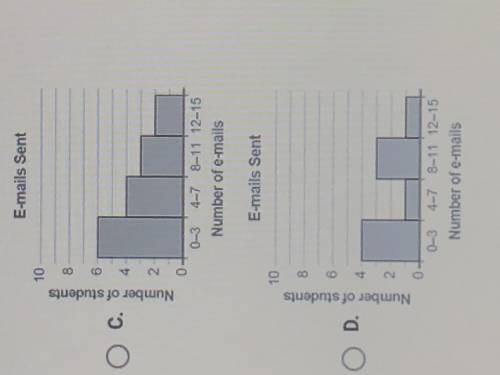
A group of students was asked about the number of e-mails they each sent
that day. The results are:
0,0,0,0,1,2,2,3,5,5, 8, 9, 10, 10, 10
Which histogram correctly shows the data set?

Answers: 2


Other questions on the subject: Mathematics
Mathematics, 22.06.2019 00:20, HelenKellerwasaSlutt
What is the value for this expression? 2e-5
Answers: 1
Mathematics, 22.06.2019 02:10, Tcareyoliver
Overproduction of uric acid in the body can be an indication of cell breakdown. this may be an advance indication of illness such as gout, leukemia, or lymphoma.† over a period of months, an adult male patient has taken nine blood tests for uric acid. the mean concentration was x = 5.35 mg/dl. the distribution of uric acid in healthy adult males can be assumed to be normal, with σ = 1.87 mg/dl. (a) find a 95% confidence interval for the population mean concentration of uric acid in this patient's blood. what is the margin of error? (round your answers to two decimal places.) lower limit upper limit margin of error (b) what conditions are necessary for your calculations? (select all that apply.) σ is unknown n is large σ is known normal distribution of uric acid uniform distribution of uric acid (c) interpret your results in the context of this problem. there is not enough information to make an interpretation. the probability that this interval contains the true average uric acid level for this patient is 0.05. the probability that this interval contains the true average uric acid level for this patient is 0.95. there is a 95% chance that the confidence interval is one of the intervals containing the population average uric acid level for this patient. there is a 5% chance that the confidence interval is one of the intervals containing the population average uric acid level for this patient. (d) find the sample size necessary for a 95% confidence level with maximal margin of error e = 1.10 for the mean concentration of uric acid in this patient's blood. (round your answer up to the nearest whole number.) blood tests
Answers: 2
You know the right answer?
A group of students was asked about the number of e-mails they each sent
that day. The results are...
Questions in other subjects:

History, 24.10.2019 17:43
Mathematics, 24.10.2019 17:43
Mathematics, 24.10.2019 17:43

Mathematics, 24.10.2019 17:43


