
Mathematics, 21.04.2021 03:20 garretthyatt123
(05.01 MC)
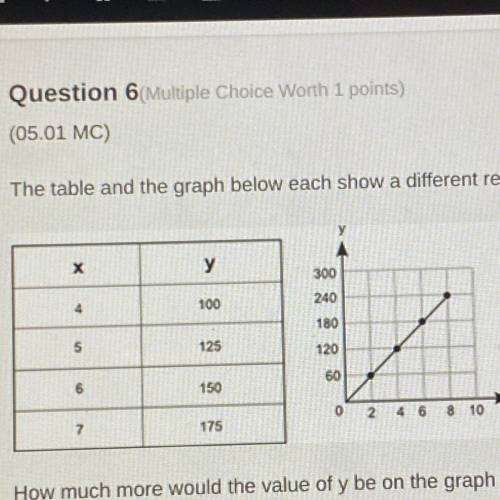
The table and the graph below each show a different relationship between the same two variables, x and y:
X
у
300
100
240
180
V
5
125
120
60
6
150
0
2 4 6 8 10
7
175
How much more would the value of y be on the graph than its value in the table when x = 12?
O20
O 30
O 60
070

Answers: 2


Other questions on the subject: Mathematics
Mathematics, 21.06.2019 21:30, cassandramanuel
Carl's candies has determined that a candy bar measuring 3 inches long has a z-score of +1 and a candy bar measuring 3.75 inches long has a z-score of +2. what is the standard deviation of the length of candy bars produced at carl's candies?
Answers: 1
Mathematics, 22.06.2019 02:00, kylahnicolewebb
Me : julio wears a blue shirt every 3 days. larry wears a blue shirt every 4 days. on april 11, both julio and larry wore a blue shirt. what is the next date that they will both wear a blue shirt?
Answers: 2
You know the right answer?
(05.01 MC)
The table and the graph below each show a different relationship between the same two v...
Questions in other subjects:


