
Mathematics, 20.04.2021 21:30 bubl6010
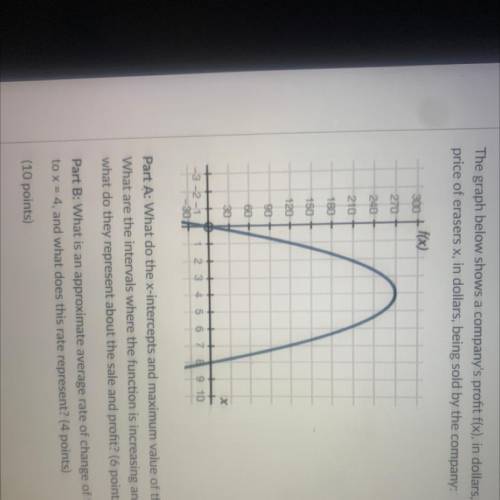
The graph below shows a company's profit f(x), in dollars, depending on the
price of erasers x, in dollars, being sold by the company:
300 + f(x)
270
240
210
180
150
120
90
60 +
30
Part A: What do the x-intercepts and maximum value of the graph represent?
What are the intervals where the function is increasing and decreasing, and
what do they represent about the sale and profit? (6 points)
Part B: What is an approximate average rate of change of the graph from x = 1
to x = 4, and what does this rate represent? (4 points)
(10 points)

Answers: 2


Other questions on the subject: Mathematics
Mathematics, 21.06.2019 16:10, deannabrown2293
The box plot shows the number of raisins found in sample boxes from brand c and from brand d. each box weighs the same. what could you infer by comparing the range of the data for each brand? a) a box of raisins from either brand has about 28 raisins. b) the number of raisins in boxes from brand c varies more than boxes from brand d. c) the number of raisins in boxes from brand d varies more than boxes from brand c. d) the number of raisins in boxes from either brand varies about the same.
Answers: 2
Mathematics, 21.06.2019 18:30, ashleytellez
41/17 as a decimal rounded to the nearest hundredth
Answers: 1
Mathematics, 21.06.2019 19:30, kklove6700
What is the result of adding the system of equations? 2x+y=4 3x-y=6
Answers: 2
You know the right answer?
The graph below shows a company's profit f(x), in dollars, depending on the
price of erasers x, in...
Questions in other subjects:
Mathematics, 28.04.2021 20:40


Biology, 28.04.2021 20:40
Biology, 28.04.2021 20:40
Biology, 28.04.2021 20:40
Mathematics, 28.04.2021 20:40


