
Mathematics, 20.04.2021 20:50 domiyisthom
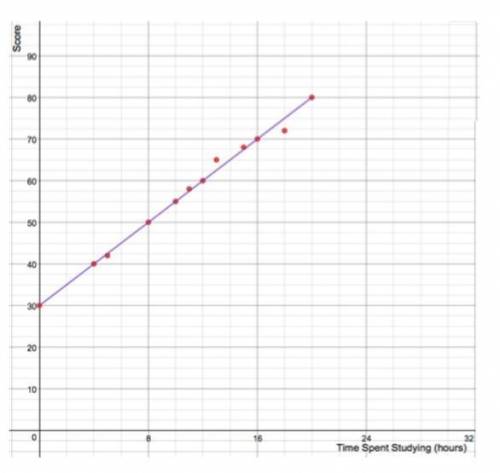
Jesse collects data on his math scores on the last 12 tests and the number of hours he spent completing his math homework assignments and studying in the week before every test. He creates a scatter plot to show the data. The regression line shown on the graph best models the data on the scatter plot. Based on the given model, how many hours in the week before the test does Jesse need to study to get a score of 90 on the test? Round your answer to the nearest hour.

Answers: 3


Other questions on the subject: Mathematics
Mathematics, 21.06.2019 20:20, shartman22
20 solve 2(4 x + 3) < 5 x + 21. a) { x | x < 9} b) { x | x > -5} c) { x | x > -9} d) { x | x < 5}
Answers: 2
Mathematics, 21.06.2019 21:30, fheight01
Name and describe the three most important measures of central tendency. choose the correct answer below. a. the mean, sample size, and mode are the most important measures of central tendency. the mean of a data set is the sum of the observations divided by the middle value in its ordered list. the sample size of a data set is the number of observations. the mode of a data set is its highest value in its ordered list. b. the sample size, median, and mode are the most important measures of central tendency. the sample size of a data set is the difference between the highest value and lowest value in its ordered list. the median of a data set is its most frequently occurring value. the mode of a data set is sum of the observations divided by the number of observations. c. the mean, median, and mode are the most important measures of central tendency. the mean of a data set is the product of the observations divided by the number of observations. the median of a data set is the lowest value in its ordered list. the mode of a data set is its least frequently occurring value. d. the mean, median, and mode are the most important measures of central tendency. the mean of a data set is its arithmetic average. the median of a data set is the middle value in its ordered list. the mode of a data set is its most frequently occurring value.
Answers: 3
Mathematics, 21.06.2019 23:30, michaellangley
Consider the input and output values for f(x) = 2x - 3 and g(x) = 2x + 7. what is a reasonable explanation for different rules with different input values producing the same sequence?
Answers: 1
You know the right answer?
Jesse collects data on his math scores on the last 12 tests and the number of hours he spent complet...
Questions in other subjects:

History, 26.09.2021 03:20

English, 26.09.2021 03:20
Mathematics, 26.09.2021 03:20
History, 26.09.2021 03:20


