
Mathematics, 20.04.2021 19:40 dkdk31
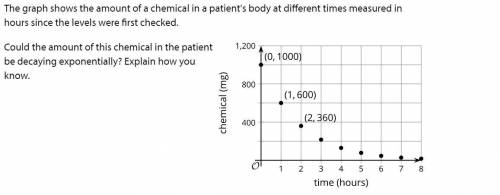
The graph shows the amount of a chemical in a patient's body at different times measured in hours since the levels were first checked. Could the amount of this chemical in the patient be decaying exponentially? Explain how you know.

Answers: 1


Other questions on the subject: Mathematics
Mathematics, 21.06.2019 20:40, Nyasiahenry
The roots of the function f(x) = x2 – 2x – 3 are shown. what is the missing number?
Answers: 2
You know the right answer?
The graph shows the amount of a chemical in a patient's body at different times measured in hours si...
Questions in other subjects:


Mathematics, 03.03.2021 23:40

Social Studies, 03.03.2021 23:40
Mathematics, 03.03.2021 23:40


