
Mathematics, 20.04.2021 18:10 morganruhl2
Help
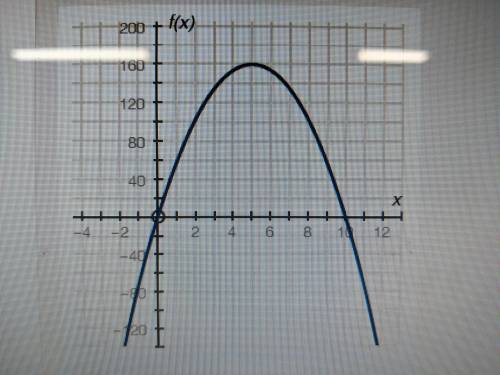
The graph below shows a company's profit f(x), in dollars, depending on the price of pencils x, in dollars, sold by the company:
Part A: What do the x-intercepts and maximum value of the graph represent? What are the intervals where the function is increasing and decreasing, and what do they represent about the sale and profit? (4 points)
Part B: What is an approximate average rate of change of the graph from x = 2 to x = 5, and what does this rate represent? (3 points)
Part C: Describe the constraints of the domain. (3 points)

Answers: 2


Other questions on the subject: Mathematics
Mathematics, 21.06.2019 16:50, thegoat3180
The lines shown below are parallel. if the green line has a slope of -1, what is the slope of the red line?
Answers: 1
Mathematics, 21.06.2019 22:30, jakails359
Atotal of 766 tickets were sold for the school play. they were either adult tickets or student tickets. there were 66 more student tickets sold than adult tickets. how many adult tickets were sold?
Answers: 1
You know the right answer?
Help
The graph below shows a company's profit f(x), in dollars, depending on the price of pencils...
Questions in other subjects:
Mathematics, 06.05.2021 08:00
Mathematics, 06.05.2021 08:00

Mathematics, 06.05.2021 08:00

Arts, 06.05.2021 08:00
Mathematics, 06.05.2021 08:00


