60 points
the revenue r (in thousands dollars) for a business is modeled by the equation...

Mathematics, 19.10.2019 07:20 arryahc
60 points
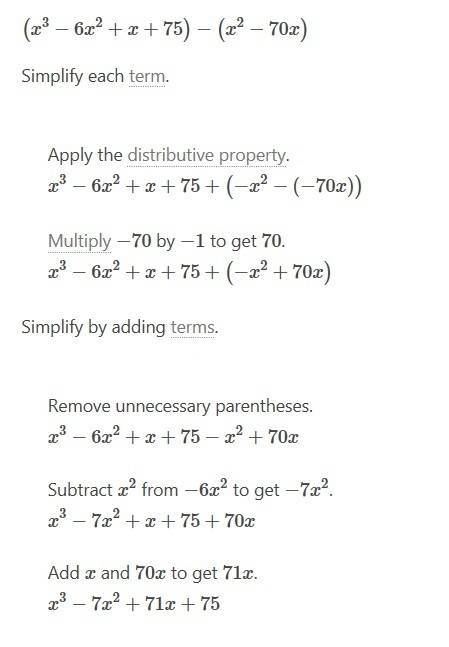
the revenue r (in thousands dollars) for a business is modeled by the equation , where x is the number of years since 2000. the cost c (in thousands dollars) for this business is modeled by the equation .
which equation represents the profit, p, for this business?

Answers: 2


Other questions on the subject: Mathematics


Mathematics, 22.06.2019 01:20, blackboy21
1. why is a frequency distribution useful? it allows researchers to see the "shape" of the data. it tells researchers how often the mean occurs in a set of data. it can visually identify the mean. it ignores outliers. 2. the is defined by its mean and standard deviation alone. normal distribution frequency distribution median distribution marginal distribution 3. approximately % of the data in a given sample falls within three standard deviations of the mean if it is normally distributed. 95 68 34 99 4. a data set is said to be if the mean of the data is greater than the median of the data. normally distributed frequency distributed right-skewed left-skewed
Answers: 2

Mathematics, 22.06.2019 01:30, joytheqt305
Arecent study focused on the number of times men and women who live alone buy take-out dinner in a month. assume that the distributions follow the normal probability distribution and the population standard deviations are equal. the information is summarized below. statistic men women sample mean 24.85 21.33 sample standard deviation 5.54 4.93 sample size 34 36 at the 0.01 significance level, is there a difference in the mean number of times men and women order take-out dinners in a month? state the decision rule for 0.01 significance level: h0: μmen= μwomen h1: μmen ≠ μwomen. (negative amounts should be indicated by a minus sign. round your answers to 3 decimal places.) compute the value of the test statistic. (round your answer to 3 decimal places.) what is your decision regarding the null hypothesis? what is the p-value? (round your answer to 3 decimal places.)
Answers: 1

Mathematics, 22.06.2019 04:30, desereemariahha
People end up tossing 12% of what they buy at the grocery store. assume this is the true population proportion and that you plan to take a sample survey of 540 grocery shoppers to further investigate their behavior. a. calculate the mean and the standard error for the sample proportion p. b. describe the sampling distribution of p in part a. draw a graph of this probability distribution with its mean and standard deviation. what is the probability that your survey will provide a sample proportion more than 15%? c. d. population proportion? what is the probability that your survey will provide a sample proportion within + 0.03 of the
Answers: 2
You know the right answer?
Questions in other subjects:

Mathematics, 12.11.2020 20:40

History, 12.11.2020 20:40

Biology, 12.11.2020 20:40


History, 12.11.2020 20:40

Mathematics, 12.11.2020 20:40

Mathematics, 12.11.2020 20:40


