The box plot below represents the number of hours judy takes to complete a quilt.\
which...

Mathematics, 20.10.2019 12:50 AliceYT
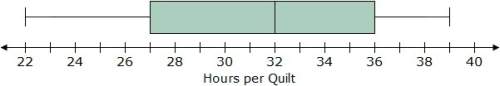
The box plot below represents the number of hours judy takes to complete a quilt.\
which data set could be represented by this box plot? a. 39, 32, 29, 22, 33, 29, 25, 37, 34
b. 25, 36, 30, 32, 34, 39, 22, 29, 36
c. 32, 36, 27, 30, 22, 35, 39, 28, 34
d. 22, 27, 38, 34, 24, 32, 33, 30, 39

Answers: 1


Other questions on the subject: Mathematics
Mathematics, 21.06.2019 21:10, lizbeth696
The vertices of a triangle are a(7.5), b(4,2), and c19. 2). what is
Answers: 1
Mathematics, 22.06.2019 04:00, warrior4516
What is the answer to this problem? ignore the work. what is the correct answer?
Answers: 1
You know the right answer?
Questions in other subjects:
Mathematics, 03.10.2021 09:30

Physics, 03.10.2021 09:30


Biology, 03.10.2021 09:30


