
Mathematics, 17.09.2019 03:00 alyssa2157
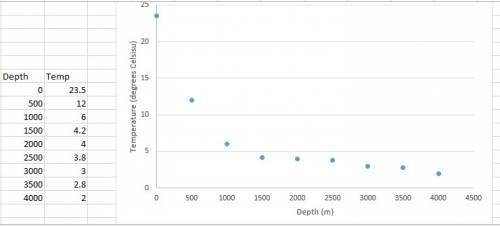
The table below shows the temperature of ocean water in degrees celsius at different depths in meters: depth (meters) 0 500 1,000 1,500 2,000 2,500 3,000 3,500 4,000 temperature (degrees celsius) 23.5 12 6 4.2 4 3.8 3 2.8 2 which scatter plot best represents the data in the table

Answers: 1


Other questions on the subject: Mathematics
Mathematics, 21.06.2019 13:00, vadrian4056
Ngrid mixes 3.6 pounds of almonds with some raisins to make a trail mix. she divides the trail mix into 12 equal portions. each portion weighs 0.7 pound. how many pounds of raisins did she use to make the trail mix? express the answer to the nearest tenth.
Answers: 1
Mathematics, 21.06.2019 14:20, blakemccain1928
Which linear inequality is represented by the graph? !
Answers: 2
Mathematics, 21.06.2019 20:30, attp203
Martha has a deck of cards. she has lost some of the cards, and now the deck only contains nine spades, eleven diamonds, eight clubs, and twelve hearts. martha predicts that whenever she draws a card from the deck without looking, she will draw a club one-fifth of the time. which activity would best allow martha to test her prediction? a. randomly draw a card from the box and see if it is a club. b. randomly draw a card. then, continue to draw another card until all eight clubs are drawn. c. randomly draw and replace a card 120 times. then, observe how close to 30 times a club is drawn. d. randomly draw and replace a card 100 times. then, observe how close to 20 times a club is drawn.
Answers: 3
You know the right answer?
The table below shows the temperature of ocean water in degrees celsius at different depths in meter...
Questions in other subjects:

Advanced Placement (AP), 25.02.2021 01:40
Mathematics, 25.02.2021 01:40
Mathematics, 25.02.2021 01:40
Mathematics, 25.02.2021 01:40

Mathematics, 25.02.2021 01:40

Arts, 25.02.2021 01:40


