
Mathematics, 17.11.2019 02:31 dshood2298
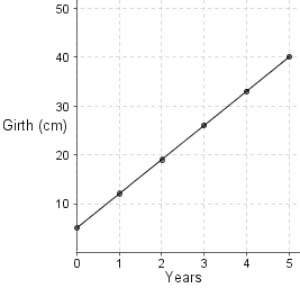
The graph shows the girth, in cm, of the trunk of a fir tree after different numbers of years: (graph image may be below)
what does the slope of the graph represent?
a)the girth increases by 7 centimeters each year.
b)the girth increases by 5 centimeters each year.
c)the original girth was 5 centimeters.
d)the original girth was 7 centimeters.

Answers: 1


Other questions on the subject: Mathematics
Mathematics, 21.06.2019 12:30, johnandashley5p65r4a
Which shows one way to determine the factors of x3 + 5x2 – 6x – 30 by grouping? x(x2 – 5) + 6(x2 – 5)x(x2 + 5) – 6(x2 + 5)x2(x – 5) + 6(x – 5)x2(x + 5) – 6(x + 5)
Answers: 3
Mathematics, 21.06.2019 17:30, CarlosCooke2
You can find the constant of proportionality by finding the ratio of
Answers: 1
Mathematics, 21.06.2019 18:00, carnations
Does anyone know how to do geometryme with this problem
Answers: 1
You know the right answer?
The graph shows the girth, in cm, of the trunk of a fir tree after different numbers of years: (grap...
Questions in other subjects:


Mathematics, 25.05.2021 02:40
Mathematics, 25.05.2021 02:40
Mathematics, 25.05.2021 02:40
Mathematics, 25.05.2021 02:40

Chemistry, 25.05.2021 02:40


